-
The Forum works well on MOBILE devices without an app: Just go to: https://forum.tsptalk.com
-
Please read our AutoTracker policy on the IFT deadline and remaining active. Thanks!
-
$ - Premium Service Content (Info) | AutoTracker Monthly Winners | Is Gmail et al, Blocking Our emails?
Find us on: Facebook & X | Posting Copyrighted Material
-
Join the TSP Talk AutoTracker: How to Get Started | Login | Main AutoTracker Page
You are using an out of date browser. It may not display this or other websites correctly.
You should upgrade or use an alternative browser.
You should upgrade or use an alternative browser.
SPN46er's Account Talk
- Thread starter SPN46er
- Start date
SPN46er
Investor
- Reaction score
- 6
Decided to start doing most of my charts via ThinkorSwim since there is so much more control over chart drawings and a larger selection of timeframes compared to StockCharts and Freestockcharts.com
I am going to try to start posting a look at the day's market action whenever I feel something interesting that occurred in regards to technical analysis (TA). Today was definitely a key day with regards to TA which is why I have already posted about 15 or so posts on my thread today! (besides I am trying to make up for my 4 years on here as a lurker :toung I am in no way an expert on TA and I take every opportunity I can get to learn new things (i.e. Elliott waves, Fibonacci retracements, etc). There is something magical (and eerie) about the way trendlines, formations, and price levels seem to work in predicting the day to day movements of the market.
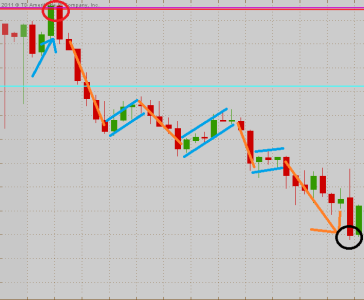
Anyways, on to today's action! I mentioned before that today was an interesting day with regards to TA, and I say this because today's price action on the SPY (an ETF that tracks the S&P 500) hit a major level of resistance. As can be seen below on a 10-minute intraday chart we started the day higher and moved right up to the 133.30 price level on the SPY. The bulls, however, were unable to overcome the resistance and the bears dominated most of the day with a series of textbook (and beautiful :nuts in-spirit-of-bear flags which allowed the SPY to close well off its intraday high. Nonetheless it was not a happy day for anyone who jumped into the C or S fund 100% before noon yesterday
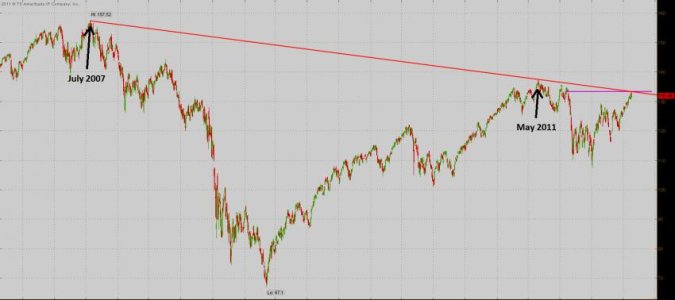
The reason why this 133.30 level is so major is that it is where a resistance level meets a very elongated trendline. To see where this trendline originates we need to go all the way back 4 some odd years to the Oct. 10, 2007 high of 157.42 on the SPY. This trendline was tested in May 2011 and was unsuccessful in closing above it. Below is a daily chart of the SPY over 5 years.
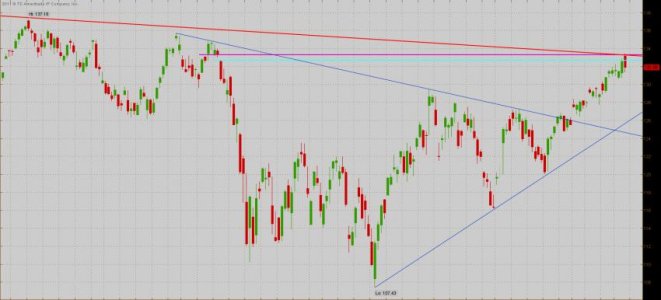
In order to see where the second aspect of this resistance level comes from we need to zoom in to the daily chart stretched over a 9 month timeframe. As you may be able to see on July 27, 2011 the SPY gapped lower and never looked back for quite some time. Today we finally filled the top of the gap window ([pink line] the close of 7/26/11 at roughly 133.30 give or take a few pennies) which coincides with the downward trendline from 2007 [red line].
The question is: can we get above this level in the coming weeks or is this the beginning of consolidation? One thing to consider is that since the beginning of the year the market has opened day to day and floated upward. This is the first day where the market opened higher and was unable to get past a major resistance level which resulted in a negative day overall.
I am going to try to start posting a look at the day's market action whenever I feel something interesting that occurred in regards to technical analysis (TA). Today was definitely a key day with regards to TA which is why I have already posted about 15 or so posts on my thread today! (besides I am trying to make up for my 4 years on here as a lurker :toung
Anyways, on to today's action! I mentioned before that today was an interesting day with regards to TA, and I say this because today's price action on the SPY (an ETF that tracks the S&P 500) hit a major level of resistance. As can be seen below on a 10-minute intraday chart we started the day higher and moved right up to the 133.30 price level on the SPY. The bulls, however, were unable to overcome the resistance and the bears dominated most of the day with a series of textbook (and beautiful :nuts

The reason why this 133.30 level is so major is that it is where a resistance level meets a very elongated trendline. To see where this trendline originates we need to go all the way back 4 some odd years to the Oct. 10, 2007 high of 157.42 on the SPY. This trendline was tested in May 2011 and was unsuccessful in closing above it. Below is a daily chart of the SPY over 5 years.

In order to see where the second aspect of this resistance level comes from we need to zoom in to the daily chart stretched over a 9 month timeframe. As you may be able to see on July 27, 2011 the SPY gapped lower and never looked back for quite some time. Today we finally filled the top of the gap window ([pink line] the close of 7/26/11 at roughly 133.30 give or take a few pennies) which coincides with the downward trendline from 2007 [red line].

The question is: can we get above this level in the coming weeks or is this the beginning of consolidation? One thing to consider is that since the beginning of the year the market has opened day to day and floated upward. This is the first day where the market opened higher and was unable to get past a major resistance level which resulted in a negative day overall.
Last edited:
crommie
Market Tracker
- Reaction score
- 9
SPN, what do you mean "I am in no way an expert"?! You are much much wiser about this stuff than the vast majority. Thank you very much for your posts and sharing your knowledge. You closed by stating "One thing to consider is that since the beginning of the year the market has opened day to day and floated upward. This is the first day where the market opened higher and was unable to get past a major resistance level which resulted in a negative day overall". What do you mean by considering this? Is this a bad sign of lower days ahead or does it mean that the bulls will be running it up again? 
Hey Tom, SPN is most certainly not a Rookie! Is there a way to elevate his status?
Hey Tom, SPN is most certainly not a Rookie! Is there a way to elevate his status?
Bquat
TSP Talk Royalty
- Reaction score
- 717
I like your nice clean charts. Easy to see.Decided to start doing most of my charts via ThinkorSwim since there is so much more control over chart drawings and a larger selection of timeframes compared to StockCharts and Freestockcharts.com
I am going to try to start posting a look at the day's market action whenever I feel something interesting that occurred in regards to technical analysis (TA). Today was definitely a key day with regards to TA which is why I have already posted about 15 or so posts on my thread today! (besides I am trying to make up for my 4 years on here as a lurker :toungI am in no way an expert on TA and I take every opportunity I can get to learn new things (i.e. Elliott waves, Fibonacci retracements, etc). There is something magical (and eerie) about the way trendlines, formations, and price levels seem to work in predicting the day to day movements of the market.
Anyways, on to today's action! I mentioned before that today was an interesting day with regards to TA, and I say this because today's price action on the SPY (an ETF that tracks the S&P 500) hit a major level of resistance. As can be seen below on a 10-minute intraday chart we started the day higher and moved right up to the 133.30 price level on the SPY. The bulls, however, were unable to overcome the resistance and the bears dominated most of the day with a series of textbook (and beautiful :nutsin-spirit-of-bear flags which allowed the SPY to close well off its intraday high. Nonetheless it was not a happy day for anyone who jumped into the C or S fund 100% before noon yesterday
View attachment 17279
The reason why this 133.30 level is so major is that it is where a resistance level meets a very elongated trendline. To see where this trendline originates we need to go all the way back 4 some odd years to the Oct. 10, 2007 high of 157.42 on the SPY. This trendline was tested in May 2011 and was unsuccessful in closing above it. Below is a daily chart of the SPY over 5 years.
View attachment 17280
In order to see where the second aspect of this resistance level comes from we need to zoom in to the daily chart stretched over a 9 month timeframe. As you may be able to see on July 27, 2011 the SPY gapped lower and never looked back for quite some time. Today we finally filled the top of the gap window ([pink line] the close of 7/26/11 at roughly 133.30 give or take a few pennies) which coincides with the downward trendline from 2007 [red line].
View attachment 17278
The question is: can we get above this level in the coming weeks or is this the beginning of consolidation? One thing to consider is that since the beginning of the year the market has opened day to day and floated upward. This is the first day where the market opened higher and was unable to get past a major resistance level which resulted in a negative day overall.
- Reaction score
- 2,465
The title is all about quantity here (post count). Reputation (green squares) gets increased with quality. Use the sheriff's badge to add to that.Hey Tom, SPN is most certainly not a Rookie! Is there a way to elevate his status?
SPN46er
Investor
- Reaction score
- 6
Thanks for the kind words guys! :embarrest:
Crommie in order to answer your question I will of course use a chart (pictures are better than words)
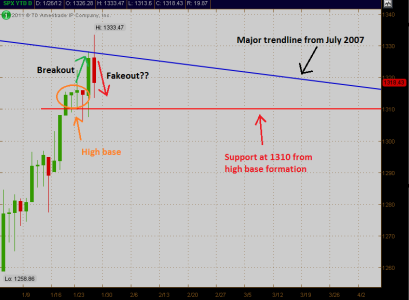
The S&P 500 broke out on Wed from a high base formation however it was only able to kiss the July 2007 trendline and closed slightly below. Today we had a slight gap up and the bulls attempted to take us over that trendline but they failed and we are still below that line. The short term good news is that we did stay above the 1310 support level which as you can see acted as support to form the high base. Until we close above the blue trendline I have to side with the bears and think we will see some short term downside. I would like to see a test of the 1310 level tomorrow to prove it is a strong support level. If it falls through we will have to look below to maybe the 1290s range for support.
Crommie in order to answer your question I will of course use a chart (pictures are better than words)

The S&P 500 broke out on Wed from a high base formation however it was only able to kiss the July 2007 trendline and closed slightly below. Today we had a slight gap up and the bulls attempted to take us over that trendline but they failed and we are still below that line. The short term good news is that we did stay above the 1310 support level which as you can see acted as support to form the high base. Until we close above the blue trendline I have to side with the bears and think we will see some short term downside. I would like to see a test of the 1310 level tomorrow to prove it is a strong support level. If it falls through we will have to look below to maybe the 1290s range for support.
SPN46er
Investor
- Reaction score
- 6
SPN46er
Investor
- Reaction score
- 6
RealMoneyIssues
TSP Legend
- Reaction score
- 101
I think it has been called... I guess we'll see today, but I suspect we are heading down for a little while
SPN46er
Investor
- Reaction score
- 6
QQQ also tested long-term resistance yesterday and failed
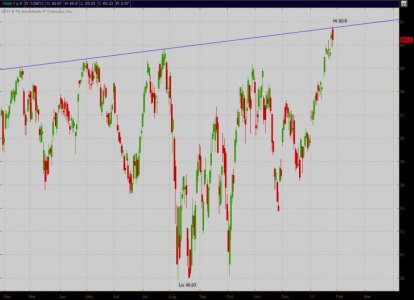
And for those of you that follow candlestick patterns we have a dark cloud cover pattern on both the QQQ and SPX (and on some other charts as well)
http://web.streetauthority.com/terms/darkcloudcover.asp
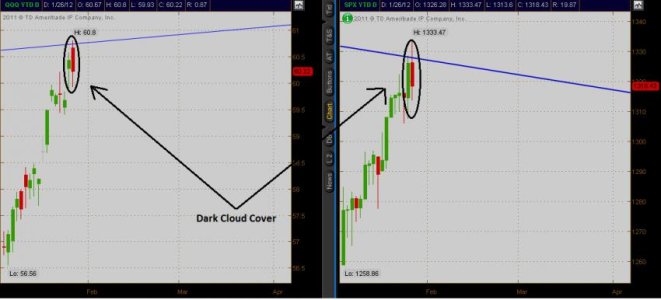

And for those of you that follow candlestick patterns we have a dark cloud cover pattern on both the QQQ and SPX (and on some other charts as well)
http://web.streetauthority.com/terms/darkcloudcover.asp

crommie
Market Tracker
- Reaction score
- 9
Crommie in order to answer your question I will of course use a chart (pictures are better than words). The S&P 500 broke out on Wed from a high base formation however it was only able to kiss the July 2007 trendline and closed slightly below. Today we had a slight gap up and the bulls attempted to take us over that trendline but they failed and we are still below that line. The short term good news is that we did stay above the 1310 support level which as you can see acted as support to form the high base. Until we close above the blue trendline I have to side with the bears and think we will see some short term downside. I would like to see a test of the 1310 level tomorrow to prove it is a strong support level. If it falls through we will have to look below to maybe the 1290s range for support.[/QUOTE said:SPN46er, thank you for your answer and another great chart. So it looks like lots of traders had their eye on that 2007 trendline as a place to take profits, which in turn resulted in a self made proficy, "see I told you that was the top, glad l sold". So now we move to the right with the high base support line just below and the 2007 trendline with a negative slope getting closer and closer just above. I guess this is where current world events and earnings reports come in. One of my favorite laws of physics is that an object in motion will stay in motion (in the same direction and at the same speed) until an external force causes it to change it's motion. Or in other words something will cause the motion of this market to either break out to the upside above the 2007 line (1330) or to drop below the high base trendline (1310). And then of coarse we have to consider the 'human' emotional factor....:laugh:
One more question, I have been hearing a lot about 1320 being the line to get above from a lot of bulls over the past few weeks. The market did that and now no one is metioning 1320. Was there a 1320 line in your option?
Thanks again and may we all turn out to be winners this year!!!
SPN46er
Investor
- Reaction score
- 6
1320 did seem to pose as a minor level of resistance. Looking the the 10 minute intraday chart on Monday the bulls tried to take the price over this 1320 level but failed. On Tuesday and Wed the market opened lower both days but the bears were unable to keep the price below the 1310 level. These 2 levels formed the bounds of the high base formation I posted earlier. Also on Wed we broke from the high base formation on news that the FOMC was not going to change interest rates until 2014. This minor level of resistance was not enough to outweigh the news and as the US dollar dropped the markets rallied. I am not sure of this but my theory is that the longer the timeframe that the trendline can be proven to be support or resistance the more major the level will be. Compound on top of that the intersection of other price levels with that trendline and you have a very key level formed for the market.
SPN46er
Investor
- Reaction score
- 6
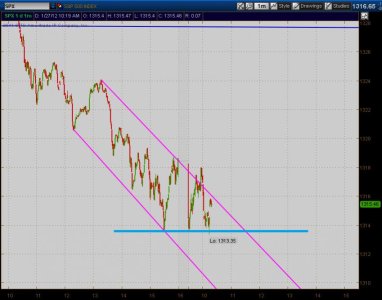
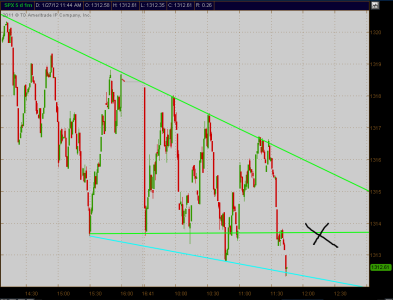
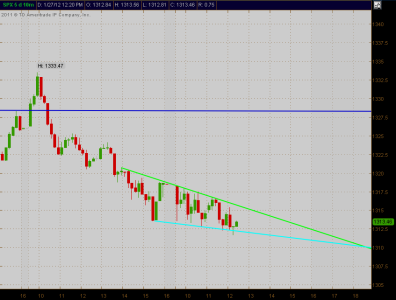
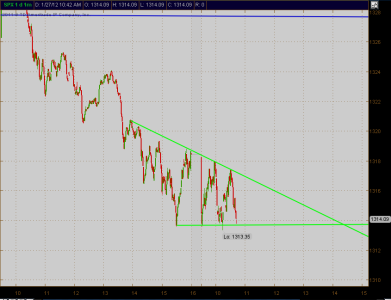
Found a new wedge on the 1-minute. I realize this is very short term trading timeframe however it does show we are finding support at the 1314 level still and we are making lower highs as we decend. Overall this means the day will end in the red for the SPX if the bulls can't take us out of this wedge.

SPN46er
Investor
- Reaction score
- 6
Rant and Rave Blog: Next Week - Stocks Set to Sell
http://www.inthemoneystocks.com/rant-and-rave-blog/item/92435-next-week-stocks-set-to-sell
http://www.inthemoneystocks.com/rant-and-rave-blog/item/92435-next-week-stocks-set-to-sell
SPN46er
Investor
- Reaction score
- 6
Looks like Facebook may file for an IPO sometime soon. Who thinks its going to pop and then flop just like the internet IPOs of 2011?
http://www.marketwatch.com/story/fa...-of-trade-halt-2012-01-27?link=MW_latest_news
http://www.marketwatch.com/story/fa...-of-trade-halt-2012-01-27?link=MW_latest_news
Similar threads
- Replies
- 5
- Views
- 406
- Replies
- 0
- Views
- 91

