SPN46er's Account Talk

um, SPX is an index, which is why I asked. Supply of SPX? I guess I just don't understand...

Sorry about the delay in the response. I don't believe the words supply and demand are being used here in the practical sense. From what I have read about this method from here http://swingtrader.tumblr.com is that the number of X's and O's are tracked using a 20 day scan of PnF charts which the numbers are available from a paid subscription. I believe from reading back a way on the blog that what he is trying to do is use these charts as a way of conveying momentum. There was one postI read that explained that the indicator is more leading rather than lagging because it is not entirely based on price. Seems like a rather complicated system however I posted the charts because I would like to track the accuracy against the markey results. As always any chart posted should be taken with a grain of salt but for now these charts may be suggesting that the bears (O's) are beginning to win out over bulls (X's) which indicates we could still have some downside left. I will be posting them as they are updated and will be looking to see how well they can predict market movements. I apologize for no explanations before posting the charts. I will try to dig up more info and post it here when I have time.
 
Right shoulder being formed on the hourly SPX chart?

View attachment 17373

As we know charts can be read in very different ways. For example, what if you traced the left shoulder back to the preceding Friday at ~1290? It's a larger pattern but it seems a little more "natural" if you ask me; that is your blue line (proposed best fit) is likely to have a better R2 value if you were taking actual data pts.
 
As we know charts can be read in very different ways. For example, what if you traced the left shoulder back to the preceding Friday at ~1290? It's a larger pattern but it seems a little more "natural" if you ask me; that is your blue line (proposed best fit) is likely to have a better R2 value if you were taking actual data pts.

I agree charting is not always an exact science and does have some level of subjectivity. My main purpose of this chart was just to convey the possibility of the emerging bearish formation rather than try to lock down price targets. Thanks for your input!
 
Yeah, I'm not trying to suggest your analysis was incorrect in any way...just pointing out that I looked at the proposed H&S and saw something a little different. I like it when people look for these patterns that occur with some frequency but I'm still trying to decide how to use that information. I am definitely a novice when it comes to markets.
 
Charting only goes so far it seems and in a market like we have today, the news is driving the market, not the technical indicators. At least this seems to be the case...but I don't know much about this stuff lol.
 
Yeah, I'm not trying to suggest your analysis was incorrect in any way...just pointing out that I looked at the proposed H&S and saw something a little different. I like it when people look for these patterns that occur with some frequency but I'm still trying to decide how to use that information. I am definitely a novice when it comes to markets.

Yep without other differing opinions this whole forum would be pointless! We would all just post the same stuff and nod our heads in unison lol!
Nodding_Emoticon_by_PacoSigs.gif
 
Whoa! One good bull run today and everyone is getting all bullish on me! I think this board is in need of a resident permabear, the anti-Birch, if you will, and I am volunteering! rawr!
cute-panda-emoticon-001.gif


J/K! :D
 
Whoa! One good bull run today and everyone is getting all bullish on me! I think this board is in need of a resident permabear, the anti-Birch, if you will, and I am volunteering! rawr!
cute-panda-emoticon-001.gif


J/K! :D

We've had a few of those. They come and go...
 
It wasn't a question of supply and demand, per se. I just don't see how you can have supply and demand of an index...

From the article I linked.

supply (resistance) and demand (support).

At a certain level there is more supply than there are buyers (resistance). In other words, people quit buying and price quits going up. The same is true for demand...more demand than there is supply (support). Prices go up because there is less supply and more demand. Clear as mud?

Thanks for the link!

upthumbs.gif
 
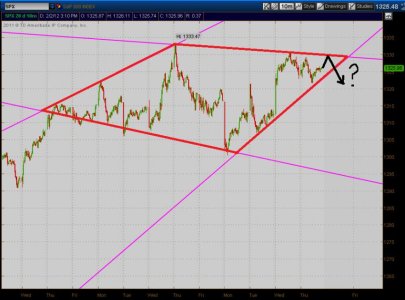
One pattern I am seeing is a diamond top pattern on the SPX which is a bearish indicator. Still not a buyer until we can either close above the 1333 high or we get a decent size pullback into the 1290 or below region. Have to watch the dollar and see what it does tomorrow and Monday. Don't want to get locked into a position only to have to pull out quickly because of a failed rally attempt.

SPXDiamondTop.jpg

http://www.trending123.com/patterns/Diamond-Top-Chart-Pattern.html
 
Back
Top