Sensei's account talk

110% how do get a cut at that?

If you're giving any less, you're not really trying. ;)


Update:

Herd: 37.5% GF 61.5% stocks
Top 50: 29.5% GF 70.5% stocks

That's insanely bullish, and has me worried that this downtrend will not bottom at the S&P 200 day SMA. I'd like to see Coolhand's numbers and what he has to say about it.

Another reason I'm worried is that we only had 2 days of downside action from that bear flag. Looking at the charts, I noticed that going back to the wicked summer of 2011, every rally off the 200 day SMA since has been precipitated by at least 3 days in the red. So either Friday's flat finish was acting as a "red" day, as it gave up most of the day's gains, or it was just a day of consolidation before the next move down.

Whatever the case may be, I side-stepped a couple % loss and have a pretty good lead on all the stock funds right now. So I'm going to hold through thick and thin.
 
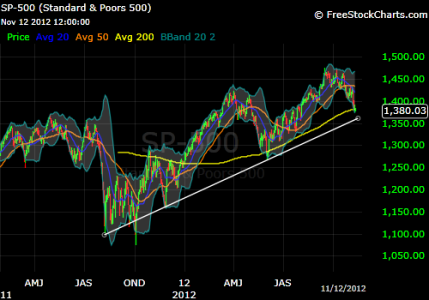
Everyone draws their support lines differently, I guess. I drew a long term trend line that could see the SPX drop to about 1360 before hitting theoretical support. Of course, to believe in this trend line, one would have to disregard a major violation of it that occurred in October of last year. That was a very volatile time - big 2-3% swings each day.

SPX 2012_11_12.png

What I like is that the bollinger bands are very stretched, and price is poking through the bottom. Primed for a snap back rally, right?

What I don't like is that everyone seems to be positioned to catch a rally, and if that long-term trend line does get violated, what does that mean for the trend going forward?
 
Everyone draws their support lines differently, I guess. I drew a long term trend line that could see the SPX drop to about 1360 before hitting theoretical support. Of course, to believe in this trend line, one would have to disregard a major violation of it that occurred in October of last year. That was a very volatile time - big 2-3% swings each day.

View attachment 21100

What I like is that the bollinger bands are very stretched, and price is poking through the bottom. Primed for a snap back rally, right?

What I don't like is that everyone seems to be positioned to catch a rally, and if that long-term trend line does get violated, what does that mean for the trend going forward?
1356 is what I have. So I agree with you.:)
 
Everyone draws their support lines differently, I guess. I drew a long term trend line that could see the SPX drop to about 1360 before hitting theoretical support. Of course, to believe in this trend line, one would have to disregard a major violation of it that occurred in October of last year. That was a very volatile time - big 2-3% swings each day. What I don't like is that everyone seems to be positioned to catch a rally, and if that long-term trend line does get violated, what does that mean for the trend going forward?

Some of the line drawing depends on the accuracy of the charting software. Ignoring the big freefall last October, stockcharts shows that the marktet has stopped right on this line, right now, at 1371.
 
Some of the line drawing depends on the accuracy of the charting software. Ignoring the big freefall last October, stockcharts shows that the marktet has stopped right on this line, right now, at 1371.

But will this prove to be a false breakout with a retest of 1371?
 
I don't know where we're headed from here, but my imaginary long-term trend line has been violated, and I don't see much support below. Where's the next stop? 1280? 1200? 1160? 1100? 1080? It doesn't matter, because I'm not going to sell. I'm going into EBIS today and upping my DCA. I'll just keep buying more of this crap on the way down, hold on to it, and someday it will be worth something again. I won't retire until I'm at least 70. By then, I won't need the money anyway, because I'll be close to dead. I'll just liquidate it for whatever it's worth and give it to my kids and grandkids. Take that 1%ers! I'll just work till I die. Ha!
 
I don't know where we're headed from here, but my imaginary long-term trend line has been violated, and I don't see much support below. Where's the next stop? 1280? 1200? 1160? 1100? 1080? It doesn't matter, because I'm not going to sell. I'm going into EBIS today and upping my DCA. I'll just keep buying more of this crap on the way down, hold on to it, and someday it will be worth something again. I won't retire until I'm at least 70. By then, I won't need the money anyway, because I'll be close to dead. I'll just liquidate it for whatever it's worth and give it to my kids and grandkids. Take that 1%ers! I'll just work till I die. Ha!

I'm thinking around 1300ish territory if you look at the weeklies. we could be seeing a huge H&S in the making, the head is just being completed and then a right shoulder. if that materializes, we could catch a nice run-up right before going to... well, down lol.

will be interesting to see how it plays out :)
 
...I'm going into EBIS today and upping my DCA. I'll just keep buying more of this crap...

I'll just work till I die. Ha!
Did it. Just upped my Roth contribution by 1%. Now contributing 10% traditional, 3% Roth. Take THAT!!!
 
Just some stats to wallow in self-pity before going to bed on a Sunday night.

  • +13.37% = my current return for the year. Not bad, right?
  • July 2nd = the first time I was up over 13% in 2012 - about 100 trading days ago.
  • +19.07% = the highest my return has been this year, on Sept. 14.
  • #48 = my current place on the Auto Tracker, despite having lost almost 6% since September.

As we close in on the end of the year, my goals are two-fold:
1) beat the L funds (was holding L2040 before I found this site in 2010)
2) be up at least 12%

I count 9 trading days left in November. Selling the next rally could be a good idea with December IFTs around the corner.

My goals are the same. If I miss it, I don't plan to commit hara-kiri.
 
Reading this morning's newpaper I see MCAS Futenna is still open. I use to go up there on the weekends and record music onto 7" reels from their library, a lot of American Air, Pam Am, Connental Air music. The locals wanted to close down the station back in the 1970s when I was there and stationed at the Air Force Base outside Naha city. Those were some wild times but we shouldn't talk about in fixed company.
 
Reading this morning's newpaper I see MCAS Futenna is still open. I use to go up there on the weekends and record music onto 7" reels from their library, a lot of American Air, Pam Am, Connental Air music. The locals wanted to close down the station back in the 1970s when I was there and stationed at the Air Force Base outside Naha city. Those were some wild times but we shouldn't talk about in fixed company.
Haha! PM me to give me the real dirt.

Not much has changed, I guess. Closing Futenma has been at the forefront of bad feelings between the Okinawans and Tokyo/Washington since I moved here almost 5 years ago. Now is an especially uncomfortable time to be here, as there have now been three cases of drunken American military members violating the peace in the last month. I wish they'd mind their Ps & Qs a little better, as I like my job and want to stay here a little longer.
 
Update:

Herd: 38% GF 62% stocks
Top 50: 28.5% GF 71.5% stocks

We're back to extreme bullish levels here on TSPTalk again. The allocation was very similar when I posted on 11/11, the day before the S fund gave up 1.8% or something. I don't know how representative we are of the greater market, but I'd feel a lot more comfortable if you guys would post a little more doom and gloom in your threads. :rolleyes:

Still too many days in November for me to sell though.
 
Update:

Herd: 45.5% GF 54.5% stocks
Top 50: 45.5% GF 54.5% stocks

Notice what happened there? ;):rolleyes:

I have a 4% lead on the S-fund, so I'll just stay right where it can't catch me - fully invested in it. Bring on Birchtree's +300 point Dow day. I'm ready for it.
 
Top 50 have made a speedy evacuation of the stock funds. I think only about 35% are currently holding stocks. Can't wait to see it flip.

Today certainly closed ominously. The perfect beginning of a bull flag/second shoulder of an inverted H&S pattern. I'll take my medicine, thank you. It will make me stronger in the end.

Exactly what I was seeing/thinking Sensei. (though I'm currently sitting safely and G waiting for a bottom so I can get in.) Thanks for mentioning it -- I'm pretty green at this game and your comments validated my thinking. Cool!
 
Update:

Herd: 55% GF 45% stocks
Top 50: 51% GF 49% stocks


Kind of strange, but as stocks push higher, we're getting more defensive. Lots of contrarians. In fact, I voted bearish on the survey as I'm afraid we've had too many up days and hitting resistance at the 50 day. Survey looks overall bullish, but will probably stay on a buy.

The obvious scenario would be a pullback, but the other way I’m thinking it could play out is another push beyond the 50 day to suck in more buyers. The upper bollinger band is just below SPX 1440, so that could be the next target. Sound crazy enough?
 
I'm feeling it too Sensei. I plan to take some of my I fund portion off the table.

Update:

Herd: 55% GF 45% stocks
Top 50: 51% GF 49% stocks


Kind of strange, but as stocks push higher, we're getting more defensive. Lots of contrarians. In fact, I voted bearish on the survey as I'm afraid we've had too many up days and hitting resistance at the 50 day. Survey looks overall bullish, but will probably stay on a buy.

The obvious scenario would be a pullback, but the other way I’m thinking it could play out is another push beyond the 50 day to suck in more buyers. The upper bollinger band is just below SPX 1440, so that could be the next target. Sound crazy enough?
 
Maybe it's just me, but I've grown reluctant to put too much stock in what the Top 50 do at the end of the year. The way I look at it is they made there money this year. There is no need to take any more risk. The Top 50 are sitting at better than 16% for the year. If I had that I'd park it in the garage and have me an early Christmas. ;)
 
Back
Top