Sensei's account talk

Enjoying summer vacation immensely. This is the first time in a long while that I haven't taken on some type of job during the summer. Used to do summer school in the States, and since joining DOD had some part-time opportunities the last two years. But no chance to earn extra money this year. So instead I'm making the most of all the free ways to entertain a 2 year-old in paradise. Bike rides, the beach, and the base pools. Sure, the extra income is missed, but any overtime I make gets taxed at 40%! (25% to IRS, 15% to CA). So it's just as well.

Here's a chart while we're at it. No revelations - just the broad strokes. Looks like we're at an overhead resistance point, but this is the third time we're knocking on the ceiling, and it looks like a descending wedge in an overall upward long-term trend. So I'm holding 100% S and hoping we see a breakthrough this July.
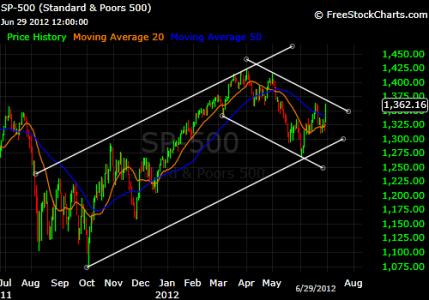
SPX 06_29_2012.png
 
For my daily viewing of stock charts, I typically have used the Wall Street Journal's site. They recently changed the whole format, which of course drove me nuts for the first few days. I'm starting to enjoy it though. Not good for posting charts with your own lines drawn in, and stuff like you can do on freestockcharts.com, but nice for personal use. Check it out:

SPX Stock Chart - Interactive - WSJ.com

It feels like we're overbought and there could be a pullback. SPX is up against the upper bollinger band and drifting well above the SMAs. There's that gap below in some of the indices. And why did the F fund pop .34% on a day that stocks were also up?

But I just checked Ocean's list, and found something very surprising. The herd is only 45% invested in stocks. The top 50 are only 45% invested in stocks. And the bottom 50 are only 35% invested in stocks. Why so much uniformity from top to bottom? Usually you see opposite extremes at the top and bottom, and somewhere in between from the herd. With everyone so tepid on stocks, I think we might just grind higher. I'll be watching for the 20 day SMA to cross the 50 day SMA on it's way up. That could trigger some short term selling. For now, though, waiting and watching.

100% S
 
Seriously dude, if you can find me some cool transportable shisas i'll make the pot right.
 
Just dusting off the old account thread. Nothing of tremendous importance to say. In hindsight, after those 5 or 6 days of rally, I should have seen this pullback coming. But I didn't want to burn up my IFTs too early in the month. Now I'm just waiting for the pullback to end and the rally to resume. Looks like today won't be the day, but I'm not doing too bad considering this is the 4th consecutive down day. We should hit support soon.
 
Hey, it looks like stocks are never going to go up again. This is awesome. The world is surely coming to an end.
 
Sensei's Account Talk

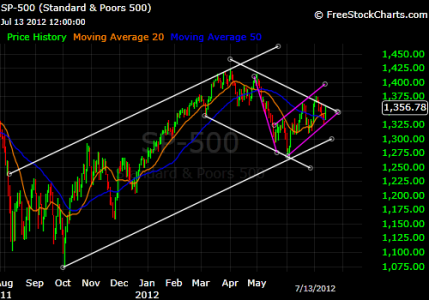
I can't remember if Bquat or Tom or someone else has already posted a chart similar to this, but I just thought I'd point it out. Long term looks like a bull flag, intermediate term looks like a bear flag. It looks like we're about to break above the descending white resistance line of the bull flag, but we could hit resistance at the lavendar line up around 1400. The question is, though, if the flag starts to get longer than the pole, is it still something to worry about?

I haven't been very good about timing short term trades this year, but have been patient in riding out the rough patches. The long term trend is still up, and now that we've consolidated after the 20 day crossing above the 50 day, everything should start looking more bullish for a while.

SPX 07_13_2012.png
 
Whew~! Back in beautiful smoggy - I mean SUNNY! - LA! Seriously, if you've only visited, you think this place is a crap hole. But if you live here long enough, you learn to love its inner-beauty. Man, I really miss this place...

Anyway, I stayed 100% S, and so far so good. Last year I was 100% S when coming back for the summer, and I lost my shorts. Hopefully this year we don't meet the same fate. I'm a little perplexed at why the small caps are lagging. Not complaining yet though.

My biggest regret is that I left the TSPTalk mug behind. Can't add to the roadtrip pics for burro! Sorry man!
 
My biggest regret is that I left the TSPTalk mug behind. Can't add to the roadtrip pics for burro! Sorry man!

If your biggest regret is forgetting a coffee cup, i'd say you're doing pretty good. What is this 'can't' you speak of?

Usually when i find i didn't pack something for a road trip i just buy a new one when i get there. I hear tom is selling them again, although he may have had to raise the cost some, it's still a bargain at any price. Plus the service is great, he can ship it anywhere and fast turnaround too. It also comes in a box inside a box, like christmas in july or something.

I buy you a replacement traveler if you find me shisa? Work it out with tom if interested. I'm good for it.
 
Hey sensei, how long you plan on californicating out there? Pm me an address with a few days lead time and it will be there. One traveller mug cleared and ready for take off. Or should i just ship it 'general delivery - el capitan'?

And what you doing checking the mb on vacation time anyway when you could be out taking road trip pics?
 
I took Vegas for $23 and got the heck out of there before they put the heat on me. Spent the last week in Hawaii, no Internet connection at all. It was fantastic. Especially to find that I didn't lose 25% of my TSP account like I did on last year's vacation. :sick:

I find today's price to be unrealistically above the 20 day SMA, so I've moved half to G. I'll let the other half ride. Here's the new allocation:

G - 50%
C - 20%
S - 30%

Welcome back!
 
Hey, I finally made it on to EBIS and was able to elect a contribution to the ROTH TSP. I went from contributing 11% to traditional to now contributing 10% traditional, 2% Roth. I wonder how much that will affect my take home pay? I get a step increase in the next pay period or two, so I'm hoping I don't notice. I guess over time my plan is to increase my Roth contribution until I'm about half-and-half. I don't want to notice it though, so I'll do it a little at a time over the next few years.

Something's funny with the market. Japan is still rolling bullishly forth with another 1% gain in the Nikkei. Europe is acting like we did yesterday - a mix of green and red, with no real conviction. I'm thinking this might be the beginning of another extended bull market like we saw from December through March, where big rallies are met with only mild consolidation, allowing the 20 day MAs to drift upward rather than price dropping down to support. So many of us on the autotracker are stubbornly lodged in G or F. I'm 50 in 50 out, so will wait to see which way we break.
 
Just a quick fact before I go to bed. Currently at +13.99% on the year, enough for #45 on the tracker. Sounds nice, but I was at 14.15% on 3/26, and over 14.5% from 7/3-5. Making it's hard enough. Keeping it is even harder.

BTW, the S&P has been up 6 days straight. I don't think that happens very often.
 
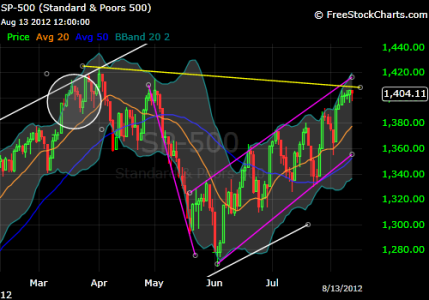
Looking back over the last six months, I saw that there was a time (in the ellipse) that the SPX was up 8 out of 9 days, and the formation looked similar to what we have now. Price elevated well above the 20 day SMA and rolled over until it bounced off it as support. The difference was that, at that time, the S&P's price was outside the bollinger band for a few days. Now, thanks to the last 4 days of flatness, price is well inside the bollies and the 20 day is starting to rise up. We could see a little more consolidation, or we could just keep heading up.

It may or may not be relevant to note that the formation in the circle I'm referring to was basically the beginning of the end of our beloved Dec-Apr bull market. I'm watching with interest.

SPX 2012_08_13.png
 
I see a huge bear flag, though it looks like we should have dropped by now.

So do you still have any TZA shares or did you sell them all with today's signal? I missed the trade so we will see who tomorrow goes.
 
Back
Top