S-fund Challenge! Guesses

Re: S-fund Challenge!

Thanks for the NN explanation. What line of work did you say you're in? :D

I think that's what the Seasonality Chart does and I've seen JTH average out particular days in relation to some other stuff, also. The patterns I get from the C, S, and I-fund don't depend on dates. So it won't matter if we transition into a bear market, the ebbchart patterns will know and adjust accordingly. I have a chart that shows the performance of the patterns during the bear market crash of 2008. In the chart below, pretty much every pattern behaved as it should except for pattern 3. I can just imagine being long and short with these patterns in 2008. :nuts:

Bearish green patterns (CSI win percentages): 1 (27%), 2 (39%), 4 (53%), 7 (53%).
Bullish red patterns (CSI win percentages): 3 (37%), 5 (55%); 6 (63%), 8 (58%).

'u Welcome;)

Yes, I've seen JTH use three inputs!:) Calendar day; Month; Day of Week. Doing this requires a lot of data to get a large enough and statistically meaningful sample size...hence, going back to 1955 and such. The issue with using old data is...well...it's old. Ask and answer for yourself: do the markets move today, with Super Montage, etc., like they did in the 50's and 60's...or 70's...or 80's...or even 90's.? If not, you're using "bad" data. That's another example of where a NN does well. As I've stated earlier, it can detect and account for subtle (or gross), "hidden," or complex variances. (Of course, the better and cleaner the data; the better the results.)

Basically, whatever you're doing, a NN should allow you to do it exponentially better, imo. For example:

Say you only trade using a simple moving average. Well plug several differently SMA's into the NN and see which performs best (using internal analysis tools of the software); then have the NN use it to generate your signals after you teach it what a "signal" is. (BTW, I did a study using indicators and NN's: I concluded that indicators are for humans; they simplify things. A NN would rather have the previous nine closing prices rather than a nine day SMA. Even so, NN can be bogged down by limited computer power and relatively too much data. So sometimes you can take short cuts like using indicators etc.)

Your charts seem to be working so far, but the race is long and the NN is now learning from every wrong move it makes. To the extent that the market is predictable, it can be predicted. Only time will tell.

By the way, NN was showing UP day for today after final round of tweaks and adjustments. It was late so I'm letting my original guess stand. Now that I've finished the spreadsheet, Going forward, I should have more firm guesses and have them earlier.

Q

UPDATE: NN is still crunching, but target so far is 984'ish ouch for me:worried:
 
Last edited:
4/17/14 long (caution: pattern 3 performed the worst in a bear market, not saying we're in one, though).
 
Re: S-fund Challenge!

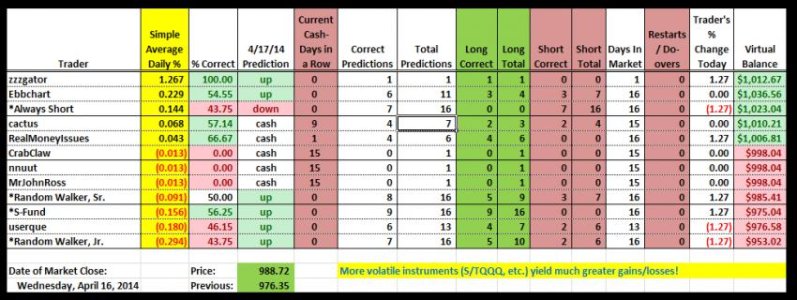
S-Fund Challenge Tally Legend, Update

The tally now includes additional virtual traders. Virtual traders now have an '*' in front of their handle for easy identification. These traders are:

*Always Short: This trader is always short the market. I added it to balance *S-Fund, who is always long the market. Can you beat them?

*Random Walker, Sr./Jr.: Sr. trades based upon the NY Numbers game. If the midday drawing for that trading day falls >=500, then he predicts the next day close to be up, else he predicts down. Jr. likewise bases his predictions on the Illinois Pick 3 Midday drawing. Shouldn't they break even if the market is random? Can you beat them? They won't be around forever; just long enough to show whether the walk is random.

I've also added a column, "Current Cash Days in a Row." This column tracks the number of days a trader has currently been in cash. It can help observers decide for themselves whether a trader is actively trading their account.

Q

Great, Short Pants should be hard to beat in bear market weather conditions. :D
 
Re: S-fund Challenge!

Unofficial: C +0.68%; S +0.47%; I -0.54% (MSCI EAFE). Close call on the FV, so we'll have to wait. :D

Dented the I-fund in the morning, then road shotgun with the S-fund in the afternoon. :rolleyes:
'Twas written in the patterns, pattern 1/grn-grn-grn that is. :cool:

Short Patterns (S-fund): 2/grn-grn-red (51.7%); 8/red-grn-red (52.4%).
Cash Patterns (S-fund): 4/grn-red-grn (53.8%); 6/red-red-grn (54.1%); 7/red-grn-grn (53.1%).
Long Patterns (S-fund): 1/grn-grn-grn (55.5%); 3/grn-red-red (56.7%); 5/red-red-red (60.1%).

S&P 500: 54.9% (7-yr. win percentage).
Strategy: short <= 53%; cash > 53% and <= 54.9%; long > 54.9%.

Wednesday: Pattern 7/red-grn-grn. 7-yr. Win Percentage (CSI 51.9%): C 54.1%, S 53.1%, I 48.3%.
Forecast: cash C-fund; cash S-fund; short I-fund.

04_14_14b.gif

Unofficial: C +1.05%; S +1.26%; I +1.21%.

Good thing pattern 7/red-grn-grn flipped from short to cash a couple days ago. Otherwise, the system would have incurred a big loss today in the S-fund. That's why I call the patterns dynamic -- it can change and adjust to market conditions. :cool:

Short Patterns (S-fund): 2/grn-grn-red (51.7%); 8/red-grn-red (52.4%).
Cash Patterns (S-fund): 4/grn-red-grn (53.8%); 6/red-red-grn (54.1%); 7/red-grn-grn (53.4%).
Long Patterns (S-fund): 1/grn-grn-grn (55.6%); 3/grn-red-red (56.7%); 5/red-red-red (60.1%).

S&P 500: 54.9% (7-yr. win percentage).
Strategy: short <= 53%; cash > 53% and <= 54.9%; long > 54.9%.

Thursday: Pattern 3/grn-red-red. Win Percentage (CSI 56.3%): C 57.0%, S 56.7%, I 55.2%.
Forecast: long C-fund; long S-fund; long I-fund.

Caution: Pattern 3 performed the worst amongst bullish red patterns during the bear market crash of 2008 (see yearly ebbtally chart). I don't know if we're about to enter one, but this pattern would be one of the indicators I'd watch.

04_15_14b.gif
 
Re: S-fund Challenge!

Up

Sent from my Samsung Galaxy S4 using tapatalk...

Noted RMI...oh, and, uh...I've joined the party:)

Ebb,

Let me know your thoughts on adding a '% long correct' and '% short correct' column and removing the long and short, correct and total columns.

I believe the % columns would more easily allow a trader to ascertain how well s/he is/isn't doing regarding long v. short trades, rather than looking at the hard numbers. Not to mention a % column would take the place of two hard number columns. Additionally, this would also mean considering the removal of the 'total' and 'correct' columns for the same reasons plus, we already have a total % correct column.

I'm not sure if you have a particular need for those hard numbers, so it's ...

Just a thought:)

Que
 
Re: S-fund Challenge!

Noted RMI...oh, and, uh...I've joined the party:)

Ebb,

Let me know your thoughts on adding a '% long correct' and '% short correct' column and removing the long and short, correct and total columns.

I believe the % columns would more easily allow a trader to ascertain how well s/he is/isn't doing regarding long v. short trades, rather than looking at the hard numbers. Not to mention a % column would take the place of two hard number columns. Additionally, this would also mean considering the removal of the 'total' and 'correct' columns for the same reasons plus, we already have a total % correct column.

I'm not sure if you have a particular need for those hard numbers, so it's ...

Just a thought:)

Que

Go ahead, userque. Your call. :D
 
Re: S-fund Challenge!

I'd watch out for this zzzgator guy. He might be one of those silent ninja assassins! :suspicious:

Yeah...there may also be alter egos on-board playing incognito:suspicious:

Ebb,

You may want to stay in CASH next week.

Que
 
Re: S-fund Challenge!

'u Welcome;)

Yes, I've seen JTH use three inputs!:) Calendar day; Month; Day of Week. Doing this requires a lot of data to get a large enough and statistically meaningful sample size...hence, going back to 1955 and such. The issue with using old data is...well...it's old. Ask and answer for yourself: do the markets move today, with Super Montage, etc., like they did in the 50's and 60's...or 70's...or 80's...or even 90's.? If not, you're using "bad" data. That's another example of where a NN does well. As I've stated earlier, it can detect and account for subtle (or gross), "hidden," or complex variances. (Of course, the better and cleaner the data; the better the results.)

I thought I heard my ears burning. All historical data is relevant within the context its used in, there are different trends during different decades, bull/bear markets, indexes and shifts in money flow. Many of these subtle differences are outlined in the Stock Trader's Almanac, I don't think we can call the data bad but we can say it can be interpreted badly. This is the reason I post data as recently as the last 10 occurrences, 20 years, and 50 years. When using seasonal data it's more important to look at the forest, not the trees, it is but one of many tools I use. Sometimes seasonal data flows with the grain, sometimes against it, the trick is be able to distinguish and accept the difference. :)
 
Re: S-fund Challenge!

I thought I heard my ears burning. All historical data is relevant within the context its used in, there are different trends during different decades, bull/bear markets, indexes and shifts in money flow. Many of these subtle differences are outlined in the Stock Trader's Almanac, I don't think we can call the data bad but we can say it can be interpreted badly. This is the reason I post data as recently as the last 10 occurrences, 20 years, and 50 years. When using seasonal data it's more important to look at the forest, not the trees, it is but one of many tools I use. Sometimes seasonal data flows with the grain, sometimes against it, the trick is be able to distinguish and accept the difference. :)

Well...if you like it, I love it. ;)
 
Re: S-fund Challenge!

Well...if you like it, I love it. ;)

Thanks, one of the things I forgot to mention, sometimes there are a huge days say +/- more than 5%. I dislike these events, they skew the average returns and if aren't taken into account, they can lead to false impressions, this is why I add Top & Bottom 3 stats.
 
Back
Top