How much further can we rally without a meaningful correction? Since the March low was put in this market has been rife with bear traps.
Yes, we were seriously oversold in March. But it's not like it was without reason. We had seen some serious shockwaves to the system. A rally was to be expected. Sentiment was solidly bearish. We were due.
Some will tell us that the market looks out 6 months ahead and trades accordingly. We are now in the 6th month since the March 9th low. Next week Wednesday with be exactly 6 months. In theory the market reacts to the future based on anticipated economic fundamentals. Most market data in the past 6 months, if it's been positive, has probably been positive more because of how far various data points have dropped and were due for some relief rather than pointing to an improving fundamental picture. This is my opinion. We've had various economic bubbles blown over many years. How can any reasonable economist say that this kind of stimulus can simply correct in a much shorter time frame?
One thing is for sure, it's obvious that market manipulation can prolong a given economic environment for a long time. Given this fact, trying to time the market based on economic fundamentals can be a real challenge.
And this is where the Seven Sentinels come in. We need a filter to help discern direction. There are many of them out there, but I've adopted this one.
This past Friday, the Seven Sentinels issued a buy signal. This meant that all seven signals flashed a buy simultaneously. Historically, a buy signal from this system means that we can expect higher prices over the Intermediate Term. Of course, by the same token a sell signal is suppose to mean the same thing in reverse. When a sell signal is given prices should drop over the Intermediate Term. For the past few months however, the Intermediate Term has gotten shorter. The signals are coming faster then they typically should. I take this to mean that the market environment is atypical. Something is causing these signals to occur at a faster rate. I believe that "something" is and has been the underlying bearish sentiment. And that sentiment has no reason to change in my opinion.
I believe much of that negative sentiment is rooted in all of the events of the past year. Simply put, many Americans are outraged and angry. Many Americans are out of work. Many Americans are incensed at an administration that arrogantly wags their collective finger at their constituents and tells them that only they (the Government) know what's best for the country. Many Americans are upset that the very crooks that got us into this mess are largely getting a free pass.
I can go on of course. But I think I've made my point. The message boards pretty much reflect this sentiment.
So with that backdrop in mind, let's look at the Seven Sentinels.
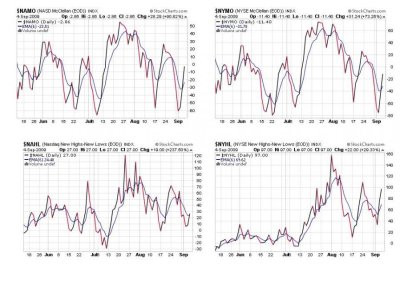
Each of these charts shows that the signal has now crossed above the 6-day exponential moving average. That constitutes a buy signal.
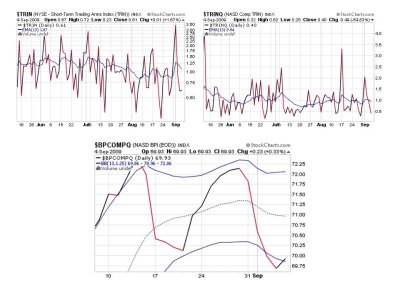
$TRIN and $TRINQ are also flashing buy signals as they are below their 13-day exponential moving averages.
$BPCOMPQ has crossed above the lower bollinger band, which constitutes a buy.
So as you can see all seven are in buy territory at the same time, which gives me the go ahead to enter the market. But before I declare my final decision, I'd like to go over some other thoughts.
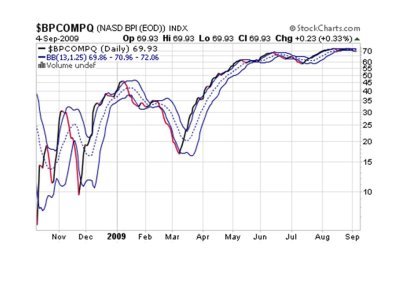
I took a closer look at $BPCOMPQ, or perhaps I should say a longer term view. Looking at the bollinger bands we can see that they are very tight right now. Especially since mid August. They also seem to have leveled off to some extent since late May and are moving in a range between 58-72 since early May. It looks toppy to me.
The point is, this buy signal does not look like a solid buy. If you look at $BPCOMPQ in the second set of slides, you can see that it hit a high of about 72.4 in mid-August, followed by a lower high of about 72.12 at the end of August. We also see a lower low was put in last week.
So I'm skeptical. And we are about to enter the toughest month of the year post labor day holiday. But wait, there's more.
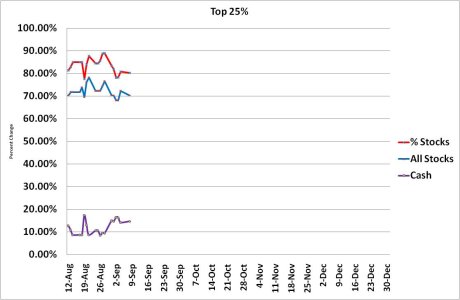
Our top 25 are still holding fast. Minor changes. Still solidly bullish.
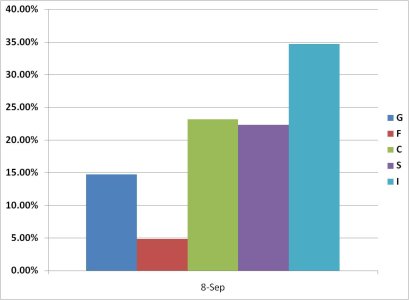
The allocation across the funds is still pretty constant too. These are the folks who have been making money the past few months.
So what's my decision?
I'm entering an IFT on Tuesday for 100% stocks, barring a complete melt-down on Tuesday. Sentiment still supports the upside more than the downside, the SS has given a buy signal, and our top 25 are not giving in.
Yes, we were seriously oversold in March. But it's not like it was without reason. We had seen some serious shockwaves to the system. A rally was to be expected. Sentiment was solidly bearish. We were due.
Some will tell us that the market looks out 6 months ahead and trades accordingly. We are now in the 6th month since the March 9th low. Next week Wednesday with be exactly 6 months. In theory the market reacts to the future based on anticipated economic fundamentals. Most market data in the past 6 months, if it's been positive, has probably been positive more because of how far various data points have dropped and were due for some relief rather than pointing to an improving fundamental picture. This is my opinion. We've had various economic bubbles blown over many years. How can any reasonable economist say that this kind of stimulus can simply correct in a much shorter time frame?
One thing is for sure, it's obvious that market manipulation can prolong a given economic environment for a long time. Given this fact, trying to time the market based on economic fundamentals can be a real challenge.
And this is where the Seven Sentinels come in. We need a filter to help discern direction. There are many of them out there, but I've adopted this one.
This past Friday, the Seven Sentinels issued a buy signal. This meant that all seven signals flashed a buy simultaneously. Historically, a buy signal from this system means that we can expect higher prices over the Intermediate Term. Of course, by the same token a sell signal is suppose to mean the same thing in reverse. When a sell signal is given prices should drop over the Intermediate Term. For the past few months however, the Intermediate Term has gotten shorter. The signals are coming faster then they typically should. I take this to mean that the market environment is atypical. Something is causing these signals to occur at a faster rate. I believe that "something" is and has been the underlying bearish sentiment. And that sentiment has no reason to change in my opinion.
I believe much of that negative sentiment is rooted in all of the events of the past year. Simply put, many Americans are outraged and angry. Many Americans are out of work. Many Americans are incensed at an administration that arrogantly wags their collective finger at their constituents and tells them that only they (the Government) know what's best for the country. Many Americans are upset that the very crooks that got us into this mess are largely getting a free pass.
I can go on of course. But I think I've made my point. The message boards pretty much reflect this sentiment.
So with that backdrop in mind, let's look at the Seven Sentinels.

Each of these charts shows that the signal has now crossed above the 6-day exponential moving average. That constitutes a buy signal.

$TRIN and $TRINQ are also flashing buy signals as they are below their 13-day exponential moving averages.
$BPCOMPQ has crossed above the lower bollinger band, which constitutes a buy.
So as you can see all seven are in buy territory at the same time, which gives me the go ahead to enter the market. But before I declare my final decision, I'd like to go over some other thoughts.

I took a closer look at $BPCOMPQ, or perhaps I should say a longer term view. Looking at the bollinger bands we can see that they are very tight right now. Especially since mid August. They also seem to have leveled off to some extent since late May and are moving in a range between 58-72 since early May. It looks toppy to me.
The point is, this buy signal does not look like a solid buy. If you look at $BPCOMPQ in the second set of slides, you can see that it hit a high of about 72.4 in mid-August, followed by a lower high of about 72.12 at the end of August. We also see a lower low was put in last week.
So I'm skeptical. And we are about to enter the toughest month of the year post labor day holiday. But wait, there's more.

Our top 25 are still holding fast. Minor changes. Still solidly bullish.

The allocation across the funds is still pretty constant too. These are the folks who have been making money the past few months.
So what's my decision?
I'm entering an IFT on Tuesday for 100% stocks, barring a complete melt-down on Tuesday. Sentiment still supports the upside more than the downside, the SS has given a buy signal, and our top 25 are not giving in.
