Project: HAL-63

Last night some thunderstorms rolled in, my trading partner Lou-da-dog got scared, so my wife woke me up.
Apparently I mumbled something about "Don't worry I got it sorted and tagged" I was dreaming about spreadsheets.

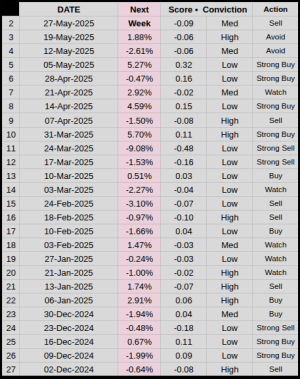
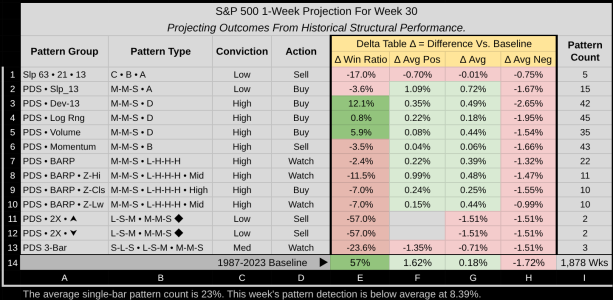
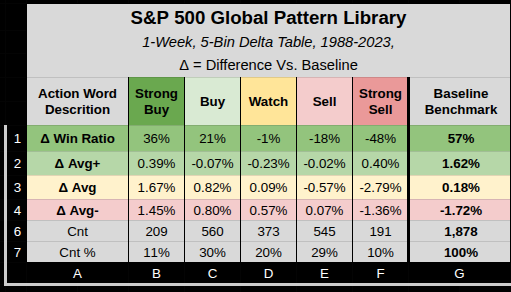
Anyhow when working at this scale, I constantly have to validate what I'm doing. The chart below is the next week's performance after the Action Word and Conviction Status. Action word (as it implies tells you what to do, but conviction is equally as important.) It is a mathematically weighted occurrence, how often it happens is very important.

Each of the 13 Pattern groups and their signals are segregated, no bleed-over, so we get 13 signals and one total-weighted signal for the entire database. The returns below are for the the week after the signals.

Screenshot_2025-06-05_18-52-01.png
 
Last night some thunderstorms rolled in, my trading partner Lou-da-dog got scared, so my wife woke me up.
Apparently I mumbled something about "Don't worry I got it sorted and tagged" I was dreaming about spreadsheets.

Anyhow when working at this scale, I constantly have to validate what I'm doing. The chart below is the next week's performance after the Action Word and Conviction Status. Action word (as it implies tells you what to do, but conviction is equally as important.) It is a mathematically weighted occurrence, how often it happens is very important.

Each of the 13 Pattern groups and their signals are segregated, no bleed-over, so we get 13 signals and one total-weighted signal for the entire database. The returns below are for the the week after the signals.

View attachment 69368
This looks awesome JTH, but I need some clarification of what is triggering the Action. Is it the weekly return? What is each Pattern group responding to?
 
This looks awesome JTH, but I need some clarification of what is triggering the Action. Is it the weekly return? What is each Pattern group responding to?

The weekly return is what transpired the week after the action, really just a back-test to confirm the trigger words and conviction levels are working.

So if you see the word Sell, the stats are what happened the following week after (or with that chart it was the average of 3272 weeks). Right now it's a read-only engine, so the action is information for the user. The action is a 5-scaled word derived from the trade score. Since each week gives 13-trade scores, I created the action words for a quick read.

The trade score is measured against the delta, each pattern compared within its group, which was ran though an AI optimizer that analyzes each pattern group against the historical delta ΔAvg+, ΔAvg, ΔAvg–, and ΔWin Ratios. Those 4 delta per-group are assigned weights & optimized to get the trade score as close to a correlation of 1. AI claims it's called "Correlation-Optimized Weighted Scoring Model"

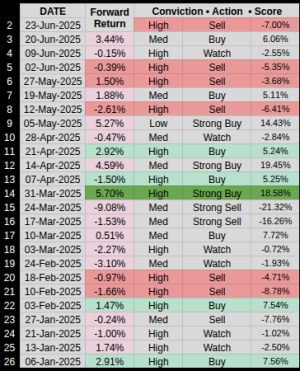
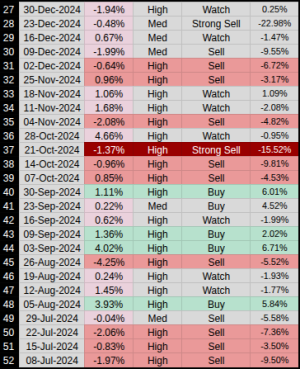
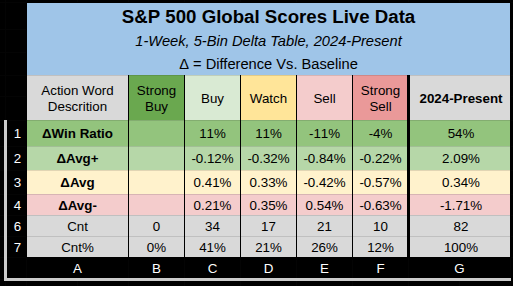
Of course we know this is "fitting the system" but with a rolling 63-years, when a new week is added, the oldest is removed. For now that's the weekly setup, here's what it generated over the most recent 26 weeks.

As an example, row 10 was a High Conviction Strong Buy, the following week the index earned 5.7%. So that basically tells the user the 13 patterns performed often (with high conviction) and well (with good Delta). This is not perfect, I still need to do a roll-forward blind back-test, but for now I'm just trying to get a working copy before moving over to the daily.

Screenshot_2025-06-06_01-48-15.png
 
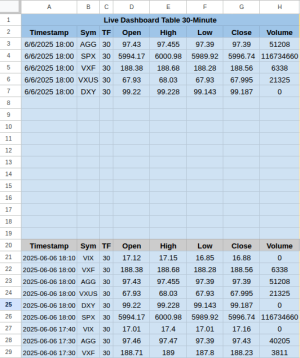
Today's battle appears successfully won.

A Tradingview pine script alert sends the closing bar's data to a webhook URL, which then relays this to google sheets app script, which then routes it to its assigned column and row. For example, when a 30-minute bar alert is received, the script routes that data to start at row 21 in column A. Alerts for other timeframes like daily, weekly, or monthly bars are directed to their own designated areas in the sheet.

The rows above at 3-19 collect the most recent bar's data, which I can then route as needed. This will be a much needed addition, my normal routine is to download the .csv for every ticker and timeframe, then paste it into the sheet.

Screenshot_2025-06-06_18-11-39.png
 
It’s a good time to explain the PDS (Pattern Detection System). I’ve gone through countless versions, my first was strict and complex, based on the Bulkowski standard, with 50 columns to define 20 patterns. It was precise but not worth the resource drain for only marginal statistical benefit.

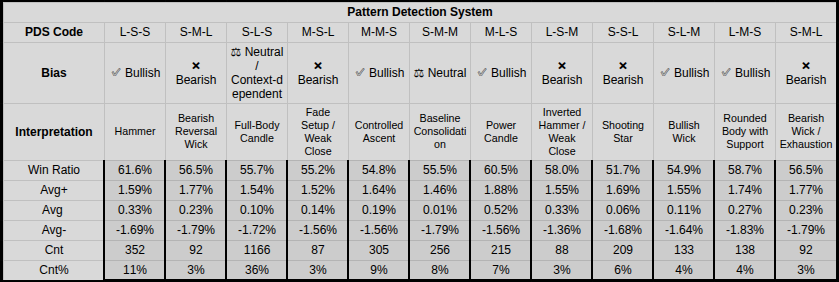
In reality, all that's needed was the lower wick, body, and upper wick, each binned as small, medium, or large. Those bins reference the candle’s range, which is essential, acting as the baseline for binning. Three bins gives a quick pattern read using 12 possible combinations. But as you can see from the table below, a pattern alone isn’t an edge, so it needs to be grouped with some context (a market condition), such as trend, volatility, and structure.

Each part (lower wick, body, upper wick) is sized as a fraction of the candle’s total range, so when we see a pattern, It can instantly be identified based on it's mathematical shape. Week 23' shape was a S-L-S (small lower wick, large body, small upper wick):
  • S: ≤20%
  • L: >40%
  • S: ≤20%
Summary: S-L-S = Long, dominant body with almost no wicks. Shows a strong, one-directional weekly move.
Screenshot_2025-06-09_12-07-45.png


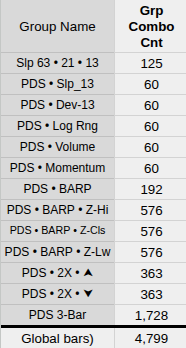
There are 13 main pattern groups with 33 sub-groups. PDS is used in 12 groups, and a total of 17 times. While the sub-groups are simple to read, they are built on complex grading rules.

While PDS alone has 12 combinations, pairing it with another sub-group multiplies the outcomes. For example, a 3-bar PDS has 1,728 possible combinations. Some are so rare they carry little statistical conviction. Out of 1,728, only 917 have actually occurred, with 409 of these just once.

Screenshot_2025-06-09_12-45-55.png


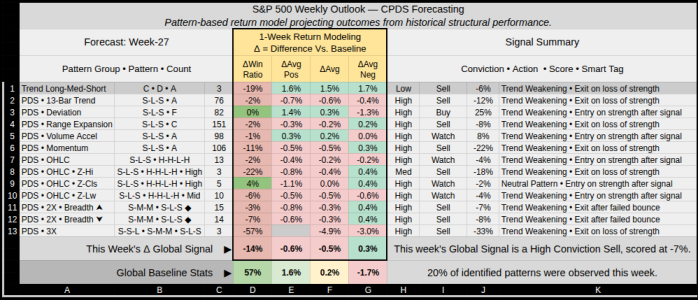
That's my lead into this week, I've spent the last few days tightening the global score (Summary Trade Score, Advised Action, and Conviction). I think it's done, but at this stage I make no promises.

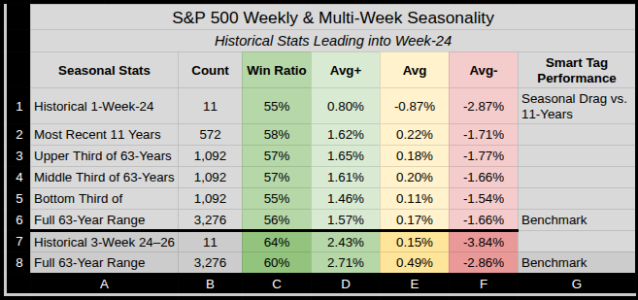
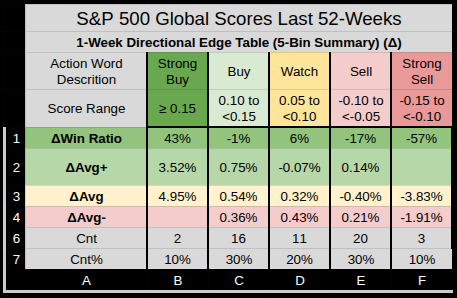
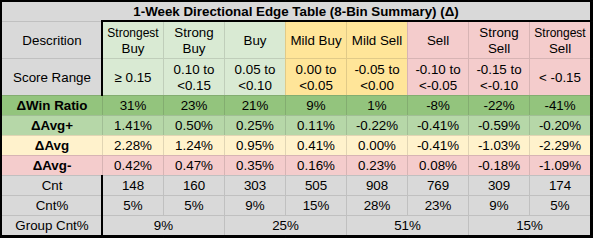
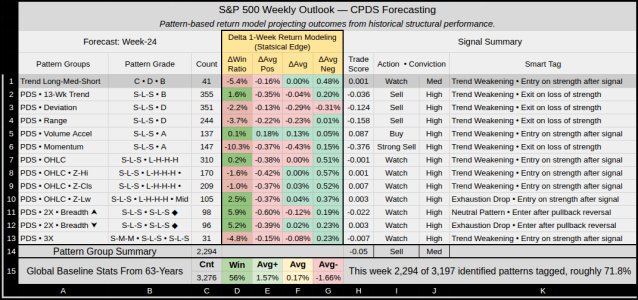
The Summary score is -.05 for this I've created a separate 8-Word Range Table to pocket in those stats.
Our score falls into a Mild / Sell bucket, the table shows a slight 1% win ratio edge over the normal 56% win ratio.
Screenshot_2025-06-09_13-07-30.pngScreenshot_2025-06-09_13-10-36.png


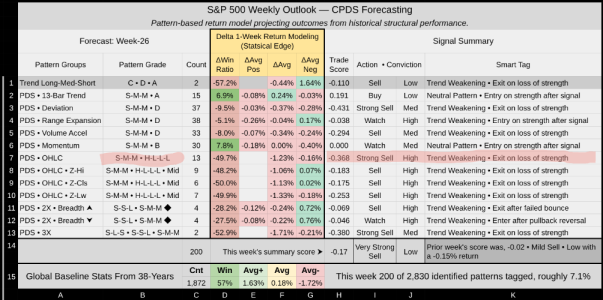
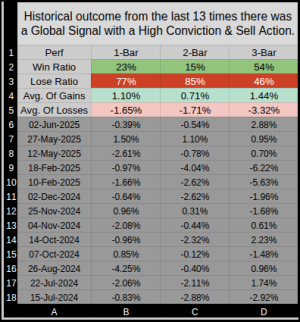
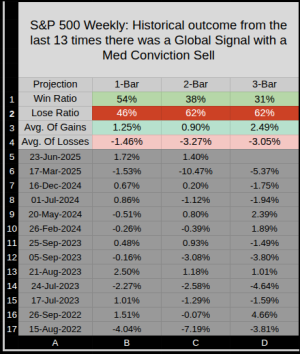
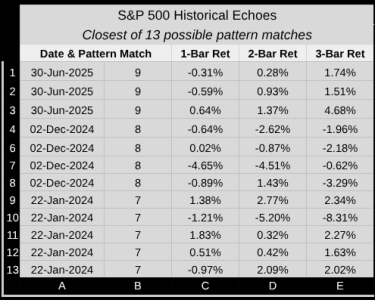
For context, it's my impression anything in the middle is a hold, so while it may say sell, it needs to match up with a higher level of conviction (frequency of occurrence). I don't think quant excels in the middle, it's those outer edge opportunities we are looking for. Here's some AI outputs.

Summary Impression — Week 24

  • General Bias:
    The dominant pattern groups (especially S-L-S with multiple overlays) point to a weakening trend. Several high-conviction “Sell” signals are flagged, with negative deltas in win ratio and average returns.
  • Sell Pressure Building:
    The S-L-S pattern in key contexts (13-week trend, Deviation, Range Expansion, Momentum) all lean bearish, and most have “High” conviction. The “Trade Score” numbers are negative, and the action tags repeatedly say “Sell” or “Strong Sell.”
  • Caution on Chasing Down:
    Some patterns suggest “Watch” or “Entry on strength after signal,” so a sharp downside follow-through is not guaranteed. The model is not calling for aggressive shorts—more of a “prepare for weakness, but wait for confirmation or failed strength.”
  • Statistical Edge:
    The short-term stats (ΔWin Ratio, ΔAvg) are modestly negative, not “crash” levels, but definitely below baseline.
  • Pattern Saturation:
    Coverage is high: 2,294 out of 3,197 patterns identified this week, about 72%. This adds statistical confidence to the model’s read.
Screenshot_2025-06-09_13-16-51.png

Simple Takeaway

  • Outlook: Trend is weakening.
    The system favors “Sell” or “Watch” (hold off on buying) for now, especially after any failed rallies or signs of exhaustion.
  • Edge Level: Medium conviction. The signals are widespread but not extreme—good for defensive positioning, tight stops on longs, and select short opportunities only if price action confirms.
  • Probabilistic call:
    • 65% probability of a weak or negative week
    • 25% probability of sideways/choppy (Watch/Neutral)
    • 10% probability of surprise strength (Buy cluster is low and not in control)
    • Expected move: Likely mild downside or range, not a crash, but high conviction on trend weakening and risk of further erosion if sellers press.
 
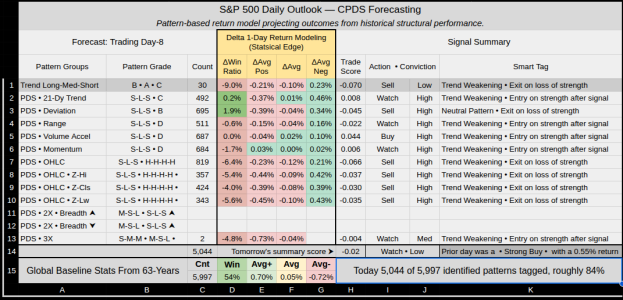
The weekly scale is largely built around the 13-Week timeframe. Below is the Daily Scale, off the 21-Day timeframe. I'm still in the process of re-mapping various metrics, the core indicators and patterns are done, but there is a lot of minor housekeeping. I've yet to re-correlate (assigned weights & optimize) but the current output is well above the delta edge, so I can hold off on that.

Here's a summary of what should be expected over the long haul, based off 6000 sessions (21 years) of patterns.
Over the past 252 sessions a Strong Buy with High conviction as been triggered 19 times, and a strong Sell 14 times.
This is about 1 full signal every 7-8 sessions. But that's misleading, there are more than a few 20+ empty session pockets with no strong signals.
Most of these signals are clustered together in small groups.

Screenshot_2025-06-11_14-49-52.png


Although it was not my intention, my initial impression, this is more of a sniper in & out setup, not well suited for a 3-10 day horizon. This is somewhat disappointing because I still want to build a 30-Minute version for a theoretical IFT 12-Noon window. I will have to spend some time thinking about this, the Daily file is already very large, as is the weekly. There is going to be another file that collects the outputs and blends them.

Anyhow here's an output for today

We have a Watch with Low conviction, but as stated this is a short 1-day projection.

Screenshot_2025-06-11_15-09-36.png
 
The evolution continues, the Weekly is large based on the 63/21/13 week scale, with indicators attached to the 13. When I began working the Daily I switched the shortest from 13 to 21. But that created a lot of work, with a lot of QC, so I've stepped back. I'm just going to make every timeframe reflect the 63/21/13 scale. This means I have 1 baseline sheet to fix and can post any timeframe and have consisten QC's results.

The other issue, I was using 3.3K bars (weeks of data) but after extensive reviews, it's not needed, and the performance degradation was not worth the gain. So I'm scaling all timeframes back to 2001 bars of history, Hal would have wanted it that way. :)

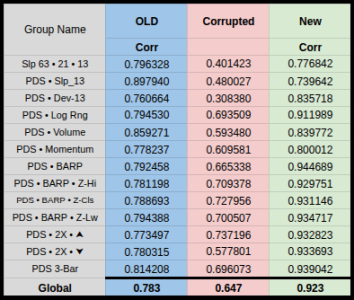
With a reduction from 63 to 38 years the grades are still accurate, but I do need to re-calibrate the Weighted Correlation Table which assign importance to each indicator in the trade score.

📊 S&P 500 Weekly Outlook — CPDS | Week-25​

⚙️ Summary Assessment — Week-25

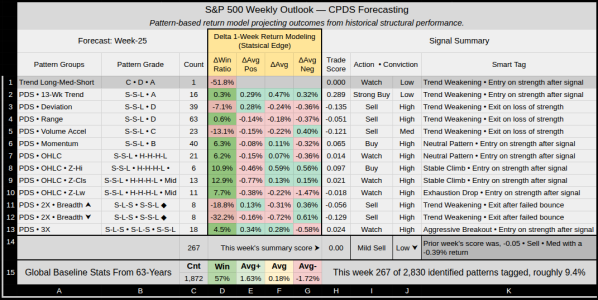
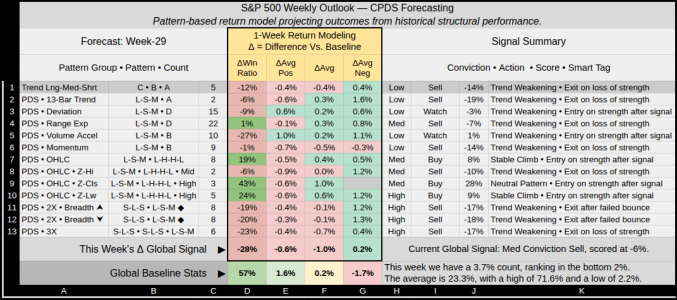
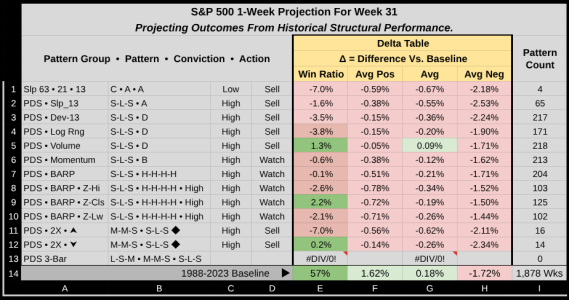
The roadmap flashes mixed signals but with a structural lean toward Mild Sell. Short-term trend layers show weakening posture, yet pockets of aggressive breakouts flicker beneath the surface. Think of this as a market losing steam, but still capable of surprise swings if sparked by news or flows.

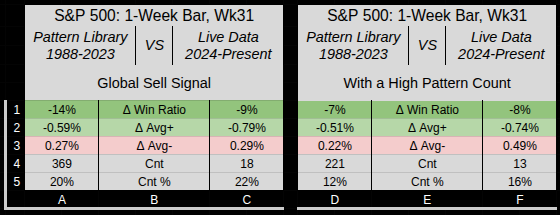
✅ Global Score: 0.00 (technically -0.000000000000000002)
✅ Bias: Mild Sell
✅ Conviction: Low ⮟
Last week’s bias was Sell with a -0.39% return.

Key Pattern Observations:
Most dominant clusters = Weakening trend, mild sell edge. One or two breakouts might punch through but keep stops razor-tight.

Screenshot_2025-06-15_12-53-01.png

⚠️ Caution Signals​

  • Signal Spread: 267 active patterns of 2,830 total → just 9.4% flagged → Low Frequency = Low Conviction
  • Flo warns: “Low frequency + mixed strength = chop risk. Strong edges show in 2–3 weeks — but the immediate bias is sideways-to-down.”


📈 Probabilistic Return Outlook — Week-25​


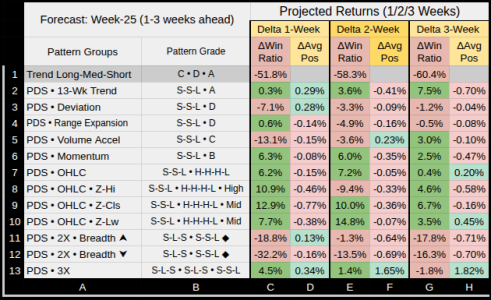
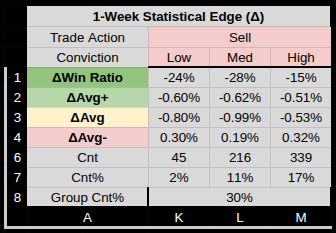
1-Week ΔEdge:
  • Strongest Buy: +38% Win Ratio, +2.19% Avg+
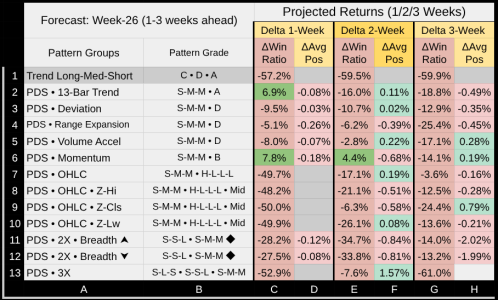
  • Mild Sell/Sell: -3% to -18% Win Ratio, negative average edge
  • Strong Sell: -33% to -46% Win Ratio, clear underperformance
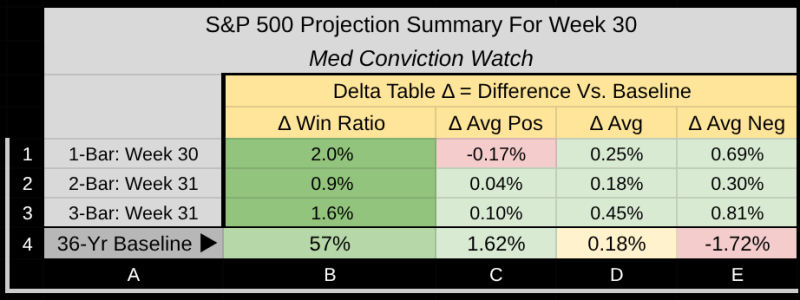
2-Week & 3-Week:
  • Upside bias grows: Multiple clusters swing to 60–80% Win Ratios in 2–3 weeks with +2% to +4% Avg+.
  • Translation: Short-term drag, but medium-term pockets to ride.

Screenshot_2025-06-15_12-56-06.png


📅 Seasonal Summary — Week-25​

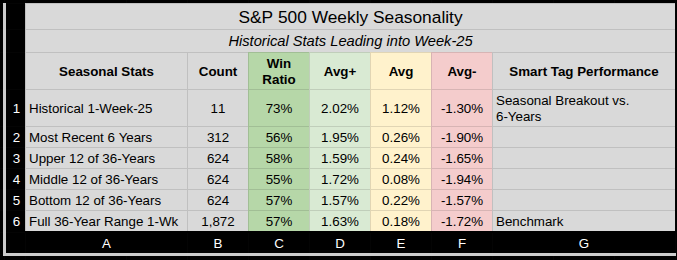
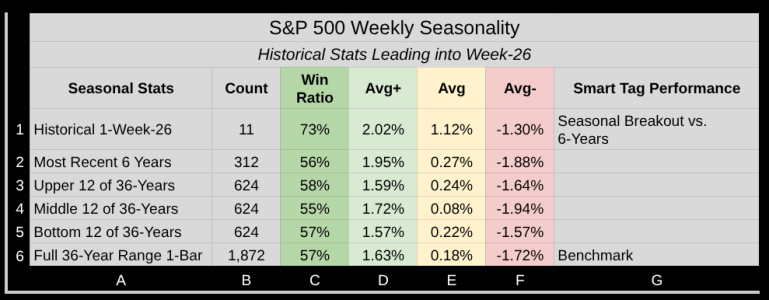
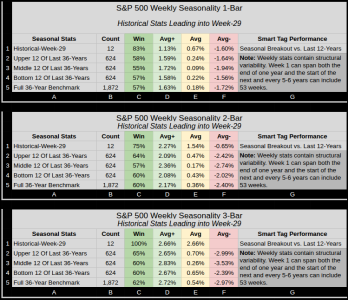
  • 6-Year Hit Rate: 73% win, +1.12% average.
  • Recent 6-Year: 56% win, +0.26% — still positive but muted.
  • Full 36-Year Range: 57% win, +0.18% — mild positive bias.
  • Seasonal pull slightly favors upside — but nowhere near enough to overpower current structural weakness alone.

    Screenshot_2025-06-15_12-59-01.png

 
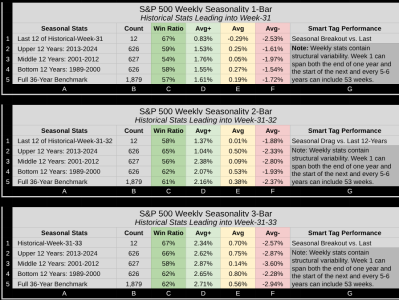
That's something new; the seasonality is based on week number and not actual dates. Interesting.

And thanks for continuing to share this with everyone!
 
  • Like
Reactions: JTH
Back
Top