Project: HAL-63

I'm currently suffering from a form of Information Presentation Paralysis.

Core Message:
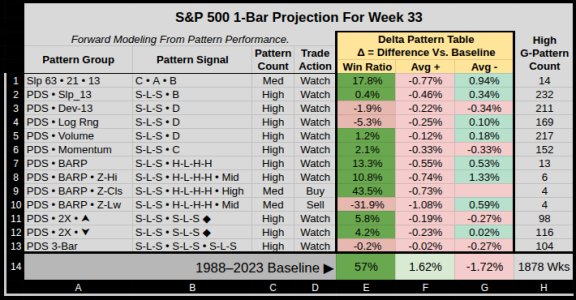
  • At present a Global Watch Signal has a 66.7% directional alignment between the most recent 52-weeks and long-term pattern behavior
  • Pattern metrics favor an upside bias with a weighted win ratio of 62.6%
  • Seasonality is weak, the next 3 weeks are in the bottom 14th percentile


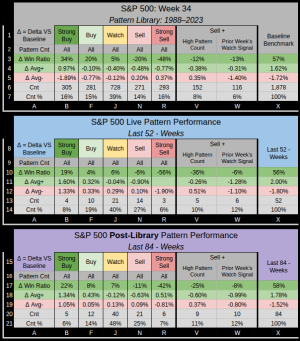
At face Value, Week-32 has generated a Global Watch Signal which is designed to encompass the middle 40% of all signals.
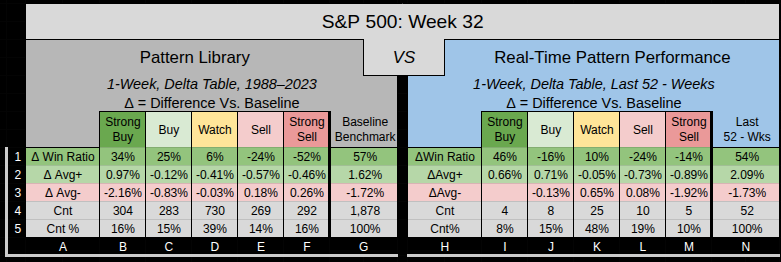
  • Pattern Library displays a 6% edge over the 57% Benchmark Win Ratio.
  • Last 52-Weeks display a 10% edge over the 54% Benchmark Win Ratio.
  • We have a High 39% Pattern Count, which is in the upper 33rd percentile.
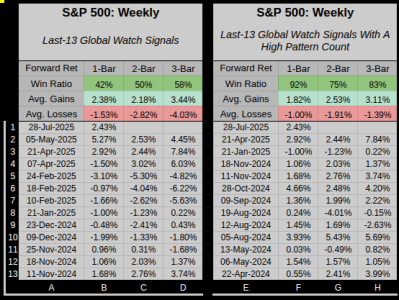
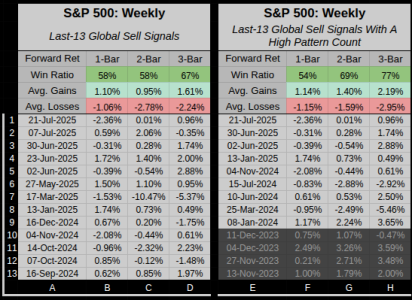
    • Last-13 Global Watch with a High Pattern Count have a 69% Win Ratio
    • Average Gains outpaced losses 1.99% vs -1.22%
  • The Prior Week-31 was a Global Sell Signal which closed down -2.36%
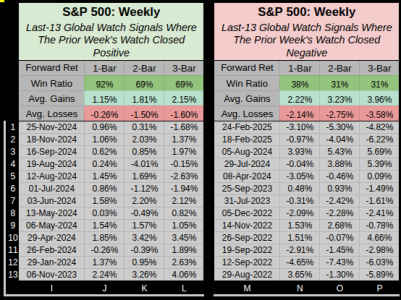
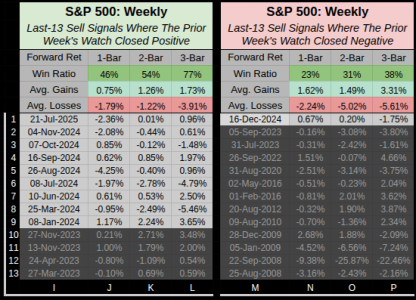
    • The Last-13 Global Watch with a prior Sell have a 31% Win Ratio
      • Losses outpaced gains -1.34% to 1.02%
    • The Last-13 Global Watch with a prior Sell that closed down have a 62% Win Ratio
      • Gains outpaced losses, 2.10% to -1.21%
Screenshot_2025-08-03_14-12-09.png

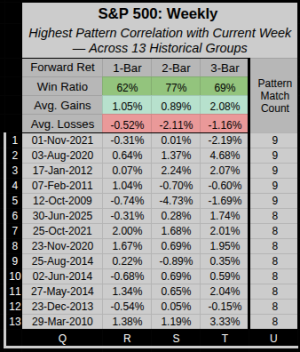
12-Year Stats

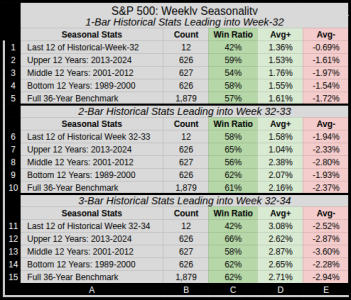
Seasonality shows a downside bias for both Week 32 & 33.

From each Chart Row-1 Column-C. Over the previous 12-years, our 1-3 Week Win Ratio is 42%, 58%. 42%


12-Year Stats

Left Chart:
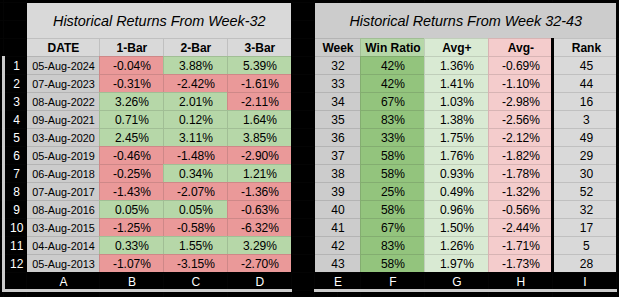
Over the past 2 years, Week-32 showed minor losses, with further downside escalation for the 2 & 3 bar performance.

Right Chart: Week-32 ranks 45th of 52, followed by Week-33 ranking 44th of 52.


That's it, we should have an exciting week if we can maintain some volatility...
 
Last edited:
Re-posting the Seasonality stats, the 2 & 3 Bar were not pushed forward in time correctly. I've also removed the Average Returns, which then slightly re-ranked the 52-weeks. For the record, the 3-Week Performance of week 32-24 over the past 12-Years ranks 49th worst of 52.

12-Year Stats: Seasonality shows a downside bias for Week 32. Our next 1-3 weeks out have Win Ratio of 42%, 58%. 42%.

Screenshot_2025-08-04_13-48-43.png

12-Year Stats

Left Chart:
Last year's 2024 gave us a 3-Bar 5.39% gain.

Right Chart: Over the next 12 weeks, Wk-34/35 have a stronger weighted-ranked performance.

Screenshot_2025-08-04_13-49-06.png
 
Last edited:
I've been having issues with backtesting.

Many of the indicators I use are custom Log-based-Z-Scored linear-reverse chronological, just like something you might see on Trading View.
But the issue with a rolling window, when new dates and data get added, the core indicator signals early in the chain can slightly shift, causing the global scores further down the chain to slightly shift. This makes it difficult to accurately back-test.

The chain goes Raw Data > Log Scale > Scored > Ranked > Graded > Signaled > then sorted into the Vertical Pattern Library where i't processed. From there The Table Performance Summary creates the Delta's and Correlations, which are then re-flattened back into Row based data where the Global Scores are recorded.

These calculations rely on context-sensitive indicators, which don't just depend on the value at the current row, but also on the range of values within the rolling windows. So the order and variance of those values shifts, this makes them highly dynamic and vulnerable to shifting results when the overall dataset changes, even if the value at the target row stays the same.

My current setup has strong statistical edges, but without the ability to theoretically and accurately go back in time and backrest, then what would be the point? The issue starts are the Scored data, so I've got to dig back into the engine, and rebuild, which would then mean I have to QC the rest of the output, and in the process maintain the edges.

Yawn....
Definitely keeping you busy.
 
  • Like
Reactions: JTH
Back
Top