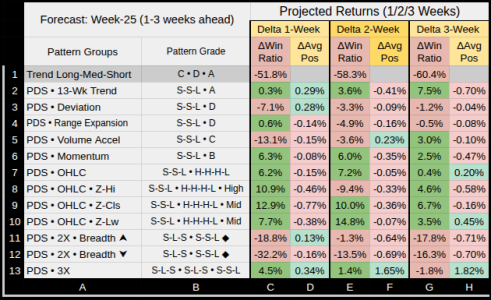
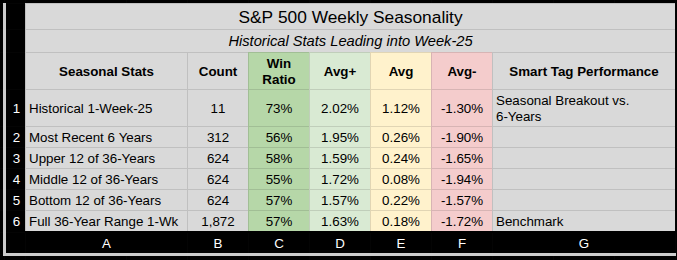
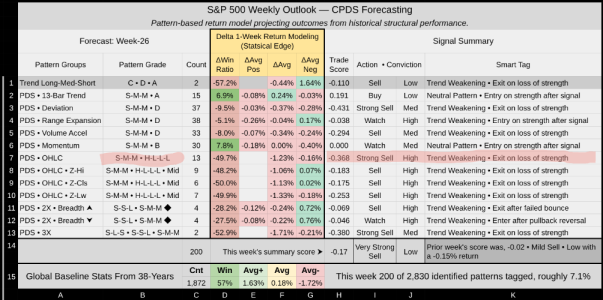
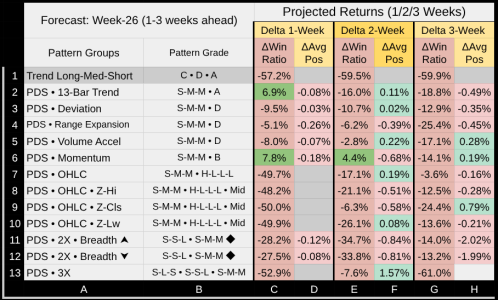
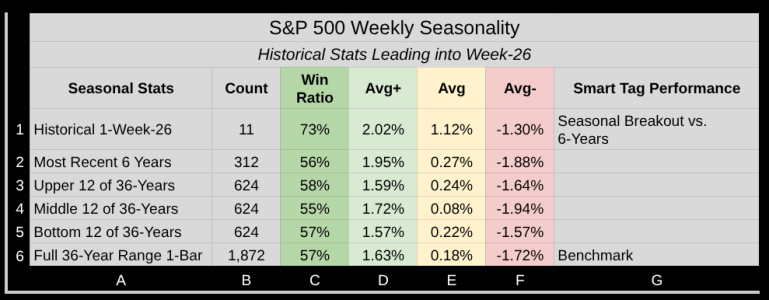
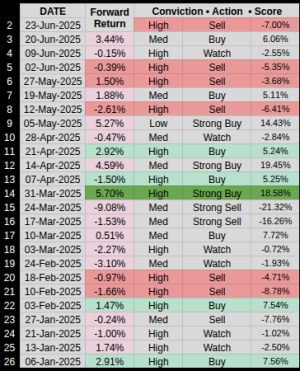
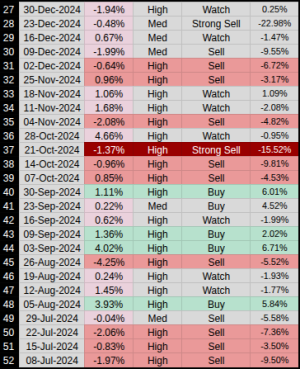
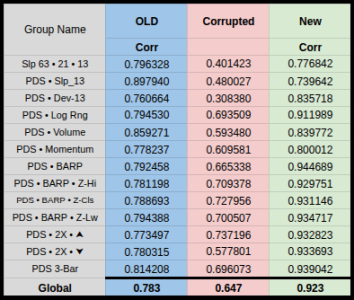
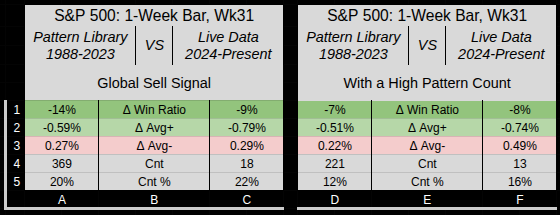
It’s a good time to explain the PDS (Pattern Detection System). I’ve gone through countless versions, my first was strict and complex, based on the Bulkowski standard, with 50 columns to define 20 patterns. It was precise but not worth the resource drain for only marginal statistical benefit.
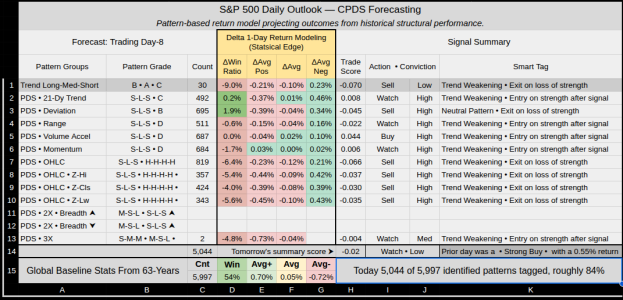
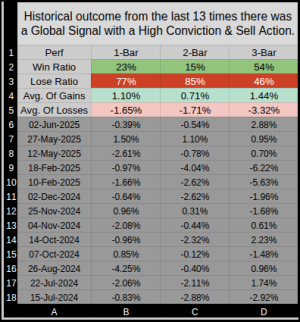
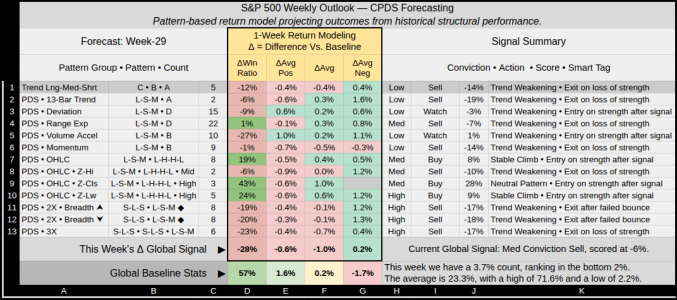
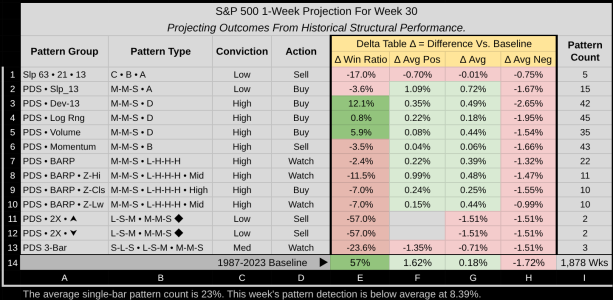
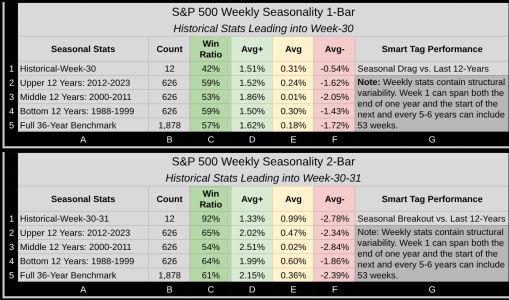
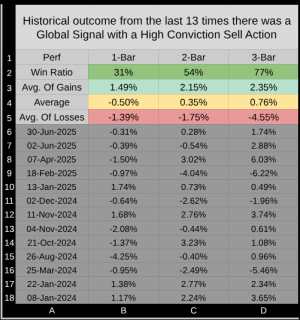
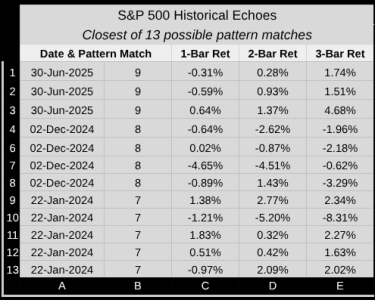
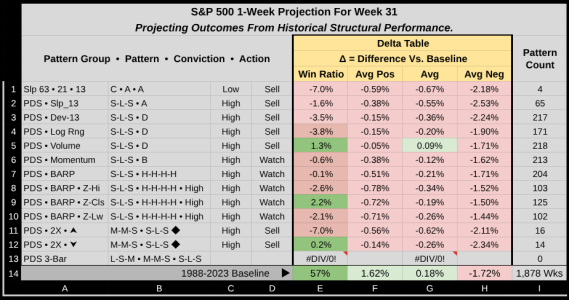
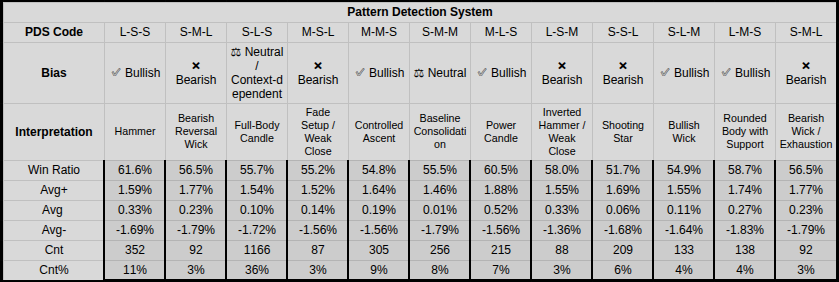
In reality, all that's needed was the lower wick, body, and upper wick, each binned as small, medium, or large. Those bins reference the candle’s range, which is essential, acting as the baseline for binning. Three bins gives a quick pattern read using 12 possible combinations. But as you can see from the table below, a pattern alone isn’t an edge, so it needs to be grouped with some context (a market condition), such as trend, volatility, and structure.
Each part (lower wick, body, upper wick) is sized as a fraction of the candle’s total range, so when we see a pattern, It can instantly be identified based on it's mathematical shape. Week 23' shape was a S-L-S (small lower wick, large body, small upper wick):
Summary: S-L-S = Long, dominant body with almost no wicks. Shows a strong, one-directional weekly move.
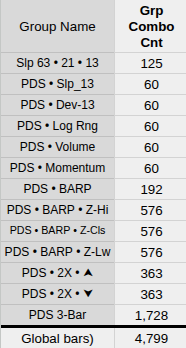
There are 13 main pattern groups with 33 sub-groups. PDS is used in 12 groups, and a total of 17 times. While the sub-groups are simple to read, they are built on complex grading rules.
While PDS alone has 12 combinations, pairing it with another sub-group multiplies the outcomes. For example, a 3-bar PDS has
1,728 possible combinations. Some are so rare they carry little statistical conviction. Out of 1,728, only 917 have actually occurred, with 409 of these just once.
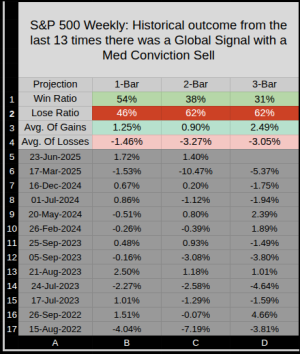
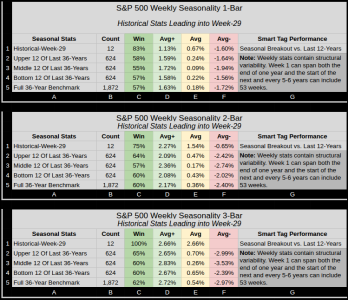
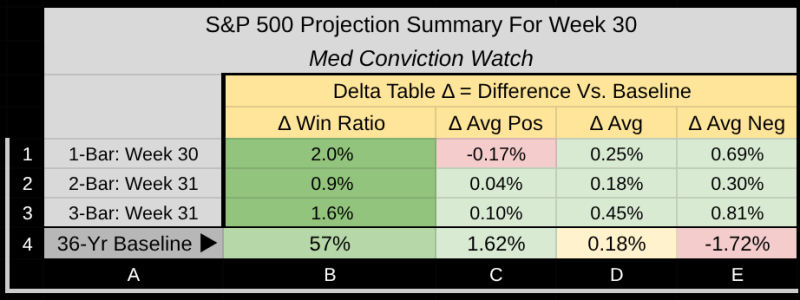
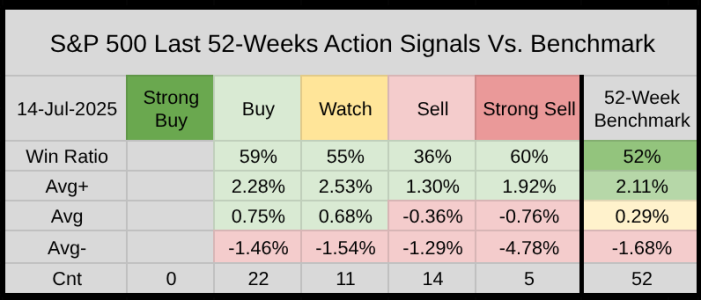
That's my lead into this week, I've spent the last few days tightening the global score (Summary Trade Score, Advised Action, and Conviction). I think it's done, but at this stage I make no promises.
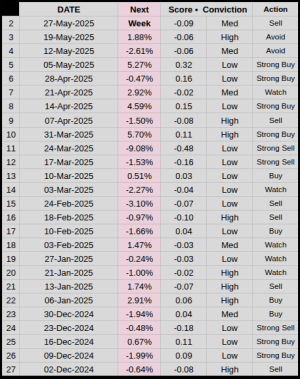
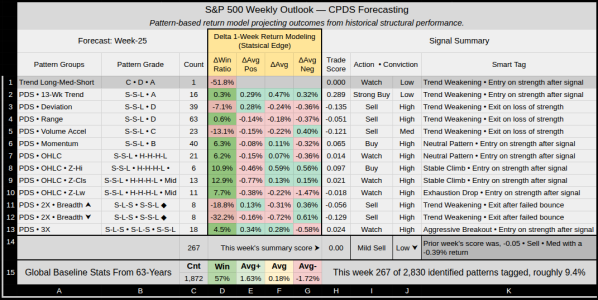
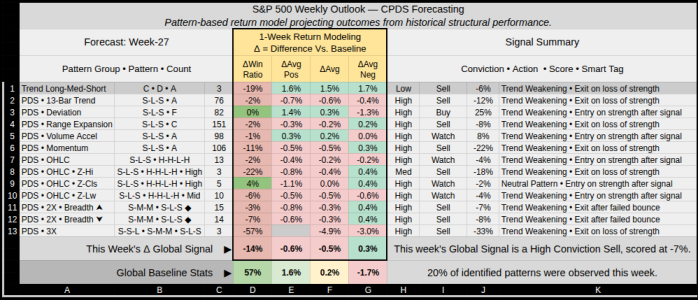
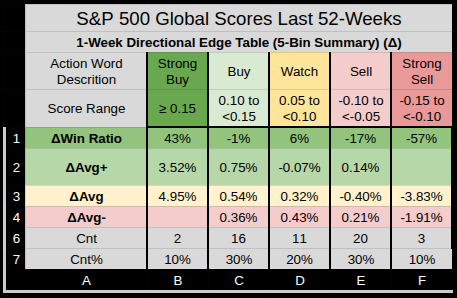
The Summary score is -.05 for this I've created a separate 8-Word Range Table to pocket in those stats.
Our score falls into a
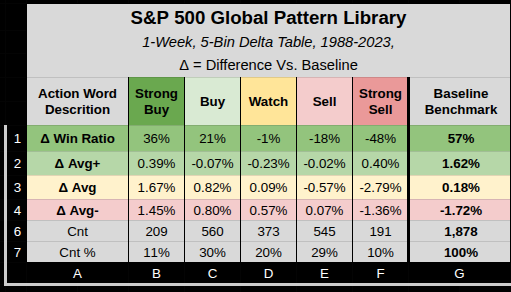
Mild / Sell bucket, the table shows a slight 1% win ratio edge over the normal 56% win ratio.
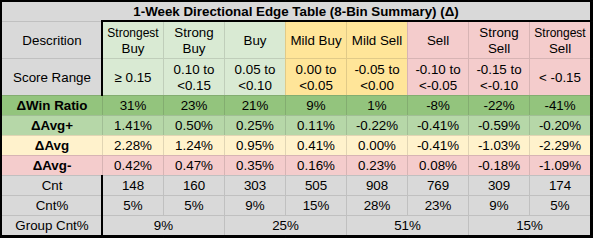
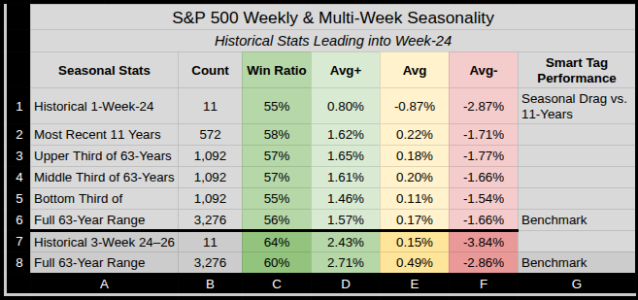
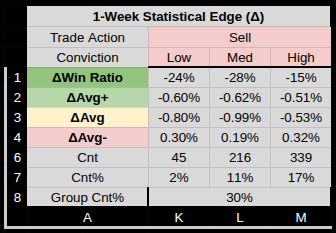
For context, it's my impression anything in the middle is a hold, so while it may say sell, it needs to match up with a higher level of conviction (frequency of occurrence). I don't think quant excels in the middle, it's those outer edge opportunities we are looking for. Here's some AI outputs.
Summary Impression — Week 24
- General Bias:
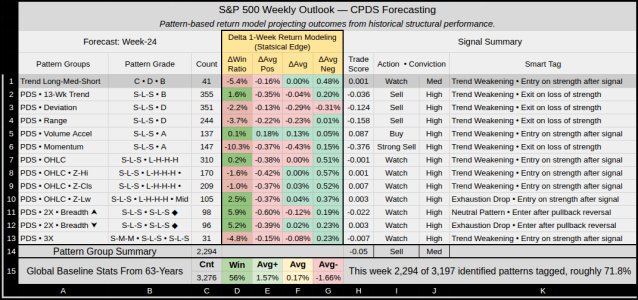
The dominant pattern groups (especially S-L-S with multiple overlays) point to a weakening trend. Several high-conviction “Sell” signals are flagged, with negative deltas in win ratio and average returns.
- Sell Pressure Building:
The S-L-S pattern in key contexts (13-week trend, Deviation, Range Expansion, Momentum) all lean bearish, and most have “High” conviction. The “Trade Score” numbers are negative, and the action tags repeatedly say “Sell” or “Strong Sell.”
- Caution on Chasing Down:
Some patterns suggest “Watch” or “Entry on strength after signal,” so a sharp downside follow-through is not guaranteed. The model is not calling for aggressive shorts—more of a “prepare for weakness, but wait for confirmation or failed strength.”
- Statistical Edge:
The short-term stats (ΔWin Ratio, ΔAvg) are modestly negative, not “crash” levels, but definitely below baseline.
- Pattern Saturation:
Coverage is high: 2,294 out of 3,197 patterns identified this week, about 72%. This adds statistical confidence to the model’s read.
Simple Takeaway
- Outlook: Trend is weakening.
The system favors “Sell” or “Watch” (hold off on buying) for now, especially after any failed rallies or signs of exhaustion.
- Edge Level: Medium conviction. The signals are widespread but not extreme—good for defensive positioning, tight stops on longs, and select short opportunities only if price action confirms.
- Probabilistic call:
- 65% probability of a weak or negative week
- 25% probability of sideways/choppy (Watch/Neutral)
- 10% probability of surprise strength (Buy cluster is low and not in control)
- Expected move: Likely mild downside or range, not a crash, but high conviction on trend weakening and risk of further erosion if sellers press.


