P&F Chart School

Hi James!
I agree with you. There could be a mild downturn but the uptrend is intact. The U.S. still holds the leadership in the traditional free world economies. We are the leaders of the global interdependency, a country that others look out for and respect as a serious safe haven for their assets. We will recover big time.
 
Just a quick note here: P&F - Heads up.

Looking at the P&F charts for the"S", the "I" and the "C" fund this week, I spotted some activity I'll write about tonight when I get some time.

The "S" fund (stockcharts symbol "$EMW" was just pennnies short of reaching it's P&F chart price objective in the last few days, when it made it up to 692.6. The Price Objective showing was 695. That's significant, and we need to be paying attention her.

The "I" fund (stockcharts symbol "EFA" ) HAS MET IT'S P&F chart price objective at 61. It's now slightly off that.


The "C" Fund (stockcharts symbol $SPX) is still a long way from it's ultimate price objetive (at 1590), but it looks like it's about ready to take a pause - breather. It's volume up has almost exactly reached the same volume as the last up cycle. It is looking very much like it is time for a pause.


I'll write some more about this tonight- I just wanted to get it out there- I may be moving to safety myself depending on what it does the next day or two- just wanted to mention that and start the discussion.

Thanks
 
Last edited:
Just a quick note here: P&F - Heads up.

Looking at the P&F charts for the"S", the "I" and the "C" fund this week, I spotted some activity I'll write about tonight when I get some time.

The "S" fund (stockcharts symbol "$EMW" was just pennnies short of reaching it's P&F chart price objective in the last few days, when it made it up to 692.6. The Price Objective showing was 695. That's significant, and we need to be paying attention her.

The "I" fund (stockcharts symbol "EFA" ) HAS MET IT'S P&F chart price objective at 61. It's now slightly off that.


The "C" Fund (stockcharts symbol $SPX) is still a long way from it's ultimate price objetive (at 1590), but it looks like it's about ready to take a pause - breather. It's volume up has almost exactly reached the same volume as the last up cycle. It is looking very much like it is time for a pause.


I'll write some more about this tonight- I just wanted to get it out there- I may be moving to safety myself depending on what it does the next day or two- just wanted to mention that and start the discussion.

Thanks

Next POMO Schedule out at 2pm EST today.
http://www.newyorkfed.org/markets/tot_operation_schedule.html
Typically, Bennie likes to fill OPEX weeks with cash, but I can't deny the feeling that we are overdue for some big $$ profit taking.
 
Note: Looking at the S&P 500, I can see soemthing- but it is much more visible on the "S" fund's P&F chart ($emw).


We're getting a triable forming here.

If it breaks to the upside, that is very, very bullish. It would need at least about another 1.5% higher from here to break on the upside.


If the triable breaks LOWER instead, that would be bearish, and I would be a seller to go sit on the sidelines for a while.

Each of these up and down days is narrowing the range on the triagle. We should know in the next couple of days if it's going to break higher (which is poistive) or lower (which is negative.)

Just mentioning this so you can keep an eye on it.
 
Note: Looking at the S&P 500, I can see soemthing- but it is much more visible on the "S" fund's P&F chart ($emw).

We're getting a triable forming here.

Each of these up and down days is narrowing the range on the triagle. We should know in the next couple of days if it's going to break higher (which is poistive) or lower (which is negative.)

Just mentioning this so you can keep an eye on it.

:confused: Im confused, are we talking about a triable or a triagle? And is that one of those three-sided things?
 
:confused: Im confused, are we talking about a triable or a triagle? And is that one of those three-sided things?

Sorry-

My bad.


Yep, one of those three sided things.

TRI-ANGLE.
070515_falwell_teletubby_hmed_hmedium.jpg
 
Note: It's breaking to the high side.

It just ticked higher in the "S" fund chart as a postive break to the high side off the triangle.

Yee-haw.

Higher ahead.

Here's the chart- showing the positive higher break out of the triangle on the "S" fund:

 
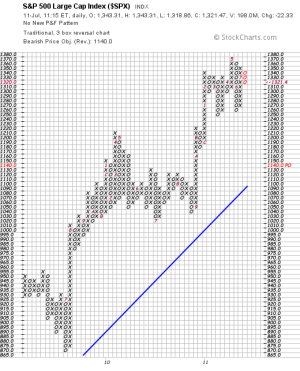
Alert- the downside today broke downward and caused a new pattern on the P&F chart.

Here's the chart:

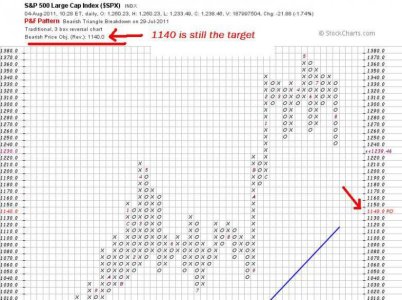
We got a double-bottom breakdown, and a BEARISH PRICE OBJECTIVE of 1240 appear. Note that this is just a preliminary bearish price objective. The data I am seeing between the lines is telling me more like 1220 or 1210, rather than 1240. Anyway, it's enough that it IS a formal change in allocation, and the "P&F Chart C" account in the auto tracker will be moving to the "G" fund for safety tomorrow.
View attachment 10755

That's it for tonight- changing allocation in the Autotracker.
Good luck.
 
Preliminary downward price objective has now been revised down to 1200. I'm expecting 1200 on the S&P 500 on the downside.
 
meaning a pull back of 50%(?)


It means the current up cycle has retraced 50% of the last up cycle, and one can expect a period of continued lower prices immediately ahead. It's not quite yet a reversal of the overall trend. It's just that we should expect continued softness in the immediate future.

I recommend starting this thread at the very beginning to learn about P&F charts.

Here is the page on "high-pole warning".
http://www.tsptalk.com/mb/showpost.php?p=133644&postcount=36

But you can see the whole thing if you read this thread from the beginning.

Enjoy.
 
Back
Top