It will break through eventually. It seems as if the market is waiting for something.Updated chart of the NYSE. Rising wedge pattern is going to come to an end in the very near future. Will it finally break through that upper resistance line, or will it fail?
View attachment 33301
-
The Forum works well on MOBILE devices without an app: Just go to: https://forum.tsptalk.com
-
Please read our AutoTracker policy on the IFT deadline and remaining active. Thanks!
-
$ - Premium Service Content (Info) | AutoTracker Monthly Winners | Is Gmail et al, Blocking Our emails?
Find us on: Facebook & X | Posting Copyrighted Material
-
Join the TSP Talk AutoTracker: How to Get Started | Login | Main AutoTracker Page
You are using an out of date browser. It may not display this or other websites correctly.
You should upgrade or use an alternative browser.
You should upgrade or use an alternative browser.
MrJohnRoss' Account Talk
- Thread starter MrJohnRoss
- Start date
wavecoder
TSP Pro
- Reaction score
- 24
Updated chart of the NYSE. Rising wedge pattern is going to come to an end in the very near future. Will it finally break through that upper resistance line, or will it fail?
looks like an ascending triangle which is a favorable pattern if you're bullish :smile:
MrJohnRoss
Market Veteran
- Reaction score
- 58
Updated chart of the NYSE. Rising wedge pattern is going to come to an end in the very near future. Will it finally break through that upper resistance line, or will it fail?
View attachment 33301
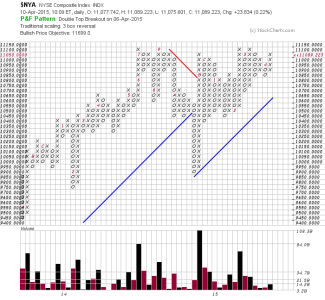
Good morning. P&F Chart of the NYSE, showing a double top break-out. Bullish price objective is 11,699. Gotta break that resistance line at 11,142 first. Currently at 11,086.

Good morning. P&F Chart of the NYSE, showing a double top break-out. Bullish price objective is 11,699. Gotta break that resistance line at 11,142 first. Currently at 11,086.
View attachment 33315
Great information! Thanks.
MrJohnRoss
Market Veteran
- Reaction score
- 58
MrJohnRoss
Market Veteran
- Reaction score
- 58
One year chart of the Transportation Index. The Trannies have stalled since December, and have a slightly negative bias based on the 50 DMA. We just dipped below the 200 DMA, which may provide some support going forward. The upturn in the last few days is encouraging, but it remains to be seen if it's going to make a meaningful push higher. We need to break last November's high of 9310 in order to call it a new bull run, which is a gain of about 6% to get us to that level. It may take us a few weeks or more to get there. Keep your eye on this index, it may hold the key to the market's future, according to the Dow Theory.
View attachment 33330
View attachment 33330
MrJohnRoss
Market Veteran
- Reaction score
- 58
Not much time to post, and not much excitement with the markets. Long term charts are showing that upside momentum is getting weaker. The easy money has already been made in past few years. Looks like a giant plateau or possibly a top is forming in the indices. Staying long the S Fund for now. Too time consuming to try to time daily market swings. Still keeping my eye on the Transports and the NYSE averages, as they may hold the key to the future market direction.
MrJohnRoss
Market Veteran
- Reaction score
- 58
Markets look like they're still trying to grind higher with up and down days. Like watching a jeep climb a muddy hill, just not a lot of traction as of late.
Transports still below the 50 DMA, but a possible up-wave looks to be in process of forming. The NYSE is very near breaking out above it's long term resistance line. Staying long S, but considering a move to C. I'll have to review relative strength graphs to see if it warrants an IFT.
Transports still below the 50 DMA, but a possible up-wave looks to be in process of forming. The NYSE is very near breaking out above it's long term resistance line. Staying long S, but considering a move to C. I'll have to review relative strength graphs to see if it warrants an IFT.
C-fund is down good time to buy!
Markets look like they're still trying to grind higher with up and down days. Like watching a jeep climb a muddy hill, just not a lot of traction as of late.
Transports still below the 50 DMA, but a possible up-wave looks to be in process of forming. The NYSE is very near breaking out above it's long term resistance line. Staying long S, but considering a move to C. I'll have to review relative strength graphs to see if it warrants an IFT.
MrJohnRoss
Market Veteran
- Reaction score
- 58
Looked at the relative strength graphs of C, S, & I, and decided to move to the I Fund. IFT effective as of the close of business today. The I Fund is a volatile ride, so tighten your seat belts.
MrJohnRoss
Market Veteran
- Reaction score
- 58
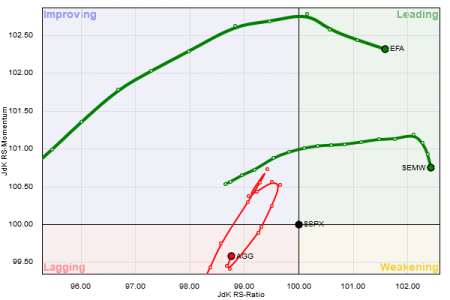
Trying something new. Here's a Relative Rotation Graph of the C, S, I, and F Funds:

With the S&P the "benchmark", this graph shows the weekly performance of the TSP Funds since the start of the year. Each quadrant of the graph is labeled as follows:
Lower Right: Weakening
Lower Left: Lagging
Upper Left: Improving
Upper Right: Leading
I set the S&P500 as the benchmark to measure all the other funds performance against it, hence the S&P is centered at 100. You will note that the I Fund (EFA) is leading all the funds at this time. In the last three weeks it's showing a bit of a cool-off, but still well in the lead. The S Fund ($EMW) has also been outperforming C, but in the last three weeks has turned down more sharply. The F Fund (AGG), has been straggling around the lagging to improving area.
Just thought it would be interesting to see another way of looking at relative performance. Let me know if you like this view, and I'll try to post it from time to time.
BuddyAnalog
First Allocation
- Reaction score
- 0
Interesting.
Thank you for sharing.
Thank you for sharing.
FogSailing
Market Veteran
- Reaction score
- 61
Nice graphic. Very thoughtful. IF I use contrarian theory this month, I'll invest in the F fund.......:laugh:
Thank you.
FS
Thank you.
FS
Itchn2retire
Investor
- Reaction score
- 6
I have been using that chart to help me identify which fund(s) I should be considering when I rebalance the accounts with Vanguard and T-Rowe Price. I then further check that fund against an Ichimoku chart. http://www.ichimokutrader.com . Once I've narrowed it down to a few funds I'll look at the candlestick charts to identify which fund(s) I should move to. Great tool for intermediate or long-term investing. Maybe not so much for short-term moves for those who are looking to jump between dips in TSP on a monthly basis.
A good example I can give is Vanguards Emerging Markets (VMMSX). I jumped into that fund at the beginning of this month because it was in the "improving" sector of the graph and it was showing a break-out on the Ichomoku chart. It's been doing quite well this month so because of that chart I was able to easily identify a fund with potential gains.
Here's a link that discusses the RRG chart further for anyone interested in using it. Relative Rotation Graph (RRG) Charts [Documentation]
MrJohnRoss
Market Veteran
- Reaction score
- 58
Been slowly paring down my stock positions over the past week, building up my cash position. The dollar is absolutely tanking, which should help the I Fund. It should also help commodities, including metals and miners. Keeping a close eye on the market internals to see if I need to go to cash in the TSP, but holding steady at this time. The talk on the street is that first quarter GDP was well below what was expected. Usually bad news is good news for the markets, but bonds (and stocks) are surprisingly down on the news.
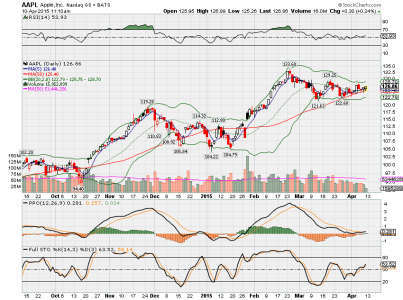
With this being a Fed day, we should expect plenty of volatility, but Fed days usually end up being a positive for the markets. Not so sure of that, as it sure appears that the Transports are in deep doo doo after failing to climb over the 50 DMA, and looking to roll over. Another bad sign is the dark cloud that appeared over AAPL yesterday. At the very least, I'm expecting a re-test of the 50 DMA for AAPL. Plenty of other market leaders are failing as well, notably the biotech sector. The graph of IBB appears to show a negative PPO in the near future, something we haven't seen since last Oct. Perhaps it's a good buying opportunity?
Keep those seatbelts fastened tightly, this roller coaster isn't done yet.
FogSailing
Market Veteran
- Reaction score
- 61
Your assessment appears to be spot on. The dollar has fallen more than I had expected, so while the I fund had become my favored option heading into May, I'm wondering if it's time for the dollar to reverse course. I'd hate to use one of my precious May IFTs for I-Fund and have to immediately jump elsewhere. This market is very unstable at the moment and I that unpredictability has me holding back until I see things a little clearer.
FS
FS
MrJohnRoss
Market Veteran
- Reaction score
- 58
Your assessment appears to be spot on. The dollar has fallen more than I had expected, so while the I fund had become my favored option heading into May, I'm wondering if it's time for the dollar to reverse course. I'd hate to use one of my precious May IFTs for I-Fund and have to immediately jump elsewhere. This market is very unstable at the moment and I that unpredictability has me holding back until I see things a little clearer.
FS
The markets are not looking too healthy this morning. Pretty much everything is in the red. The fact that the transports failed the 50 DMA test is the most troubling to me. Dow Theory says that the markets can't continue higher if the Transports are going down.
It's also looking like Mr. VIX is waking up from his slumber (current level at 14 and change this morning). The general trend for the VIX has been down since the beginning of February, as it's been bouncing off the 12ish range. It's now looking like a possible bottoming formation has taken place, and an intermediate term move higher is in process. I know it's still too early to confirm, but the Stoch and PPO are beginning to show signs of a possible move higher. This could spell trouble for the markets as well.
Still thinking that EFA should outperform the U.S. markets in the near term, since they're in the process of trillion euro QE pumping. The Harbinger is warning of a massive reset later this year, which is entirely possible. It would start with Greece, IMHO. Keep your eyes peeled for the dominos to start teetering.
Valkyrie
TSP Pro
- Reaction score
- 220
The Harbinger is warning of a massive reset later this year, which is entirely possible.
Shemitah 9/13/15
Similar threads
- Replies
- 0
- Views
- 85
- Replies
- 0
- Views
- 152
- Replies
- 0
- Views
- 166

