Just wanted to go over a few signals on the Seven Sentinels so we can see how they are faring this week.
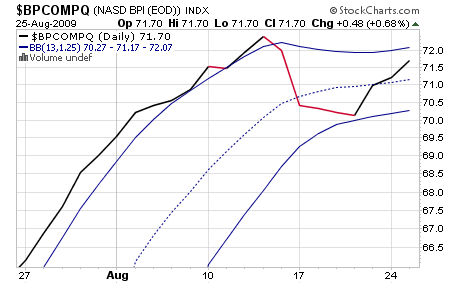
First chart is $BPCOMPQ:

This signal has been the one hold-out that has prevented the SS from issuing a buy signal, but we can see that it's been improving the past two trading days. The center-line needs to cross the upper bollinger band to go to a buy at this point. One more good push higher on the NAZ would probably do it, if it happens tomorrow.
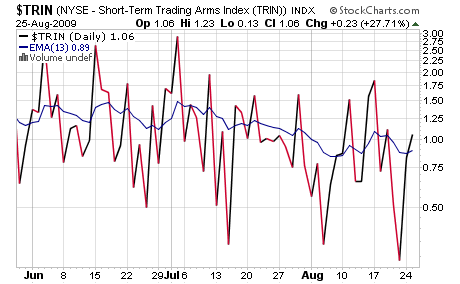
However, I'd said the other day that even if $BPCOMP goes to a buy, the other signals may not hold, which brings me to the next signal ($TRIN):

This signal crossed up above the 6 day Exponential Moving Average and is now on a sell. But this signal can flip quickly back to a buy as it's not showing a strong sell right now.
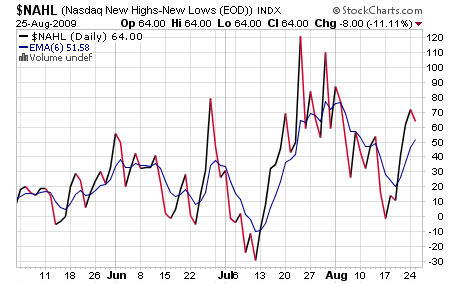
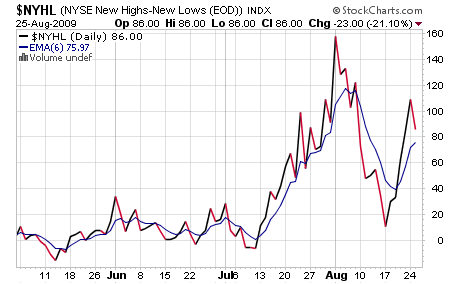
The next two charts are $NAHL and $NYHL:


The signals shown on both these charts are deteriorating slowly, but are still on a buy. $NYHL is closer to a sell than $NAHL. Moderate weakness in the next day or two could push both signals to a sell.
The other 3 signals $NAMO, NYMO, and $TRINQ remain on a buy. So currently, we have 2 signals on a sell and 5 on a buy. We need all 7 in buy mode to get a buy signal in which case I would enter the market.
First chart is $BPCOMPQ:

This signal has been the one hold-out that has prevented the SS from issuing a buy signal, but we can see that it's been improving the past two trading days. The center-line needs to cross the upper bollinger band to go to a buy at this point. One more good push higher on the NAZ would probably do it, if it happens tomorrow.
However, I'd said the other day that even if $BPCOMP goes to a buy, the other signals may not hold, which brings me to the next signal ($TRIN):

This signal crossed up above the 6 day Exponential Moving Average and is now on a sell. But this signal can flip quickly back to a buy as it's not showing a strong sell right now.
The next two charts are $NAHL and $NYHL:


The signals shown on both these charts are deteriorating slowly, but are still on a buy. $NYHL is closer to a sell than $NAHL. Moderate weakness in the next day or two could push both signals to a sell.
The other 3 signals $NAMO, NYMO, and $TRINQ remain on a buy. So currently, we have 2 signals on a sell and 5 on a buy. We need all 7 in buy mode to get a buy signal in which case I would enter the market.
