Where will the market find support and reverse? Here is a weekend update showing four long term charts, in the daily timeframe, of the simple moving average (ma). The moving averages may not look familiar to you, because they are long term and follow the Fibonacci sequence. They are the: 233, 377 and 610 moving averages. Because of the recent fairly severe sell-off, they may be useful as a guide post to see where a possible turning point area may lie.
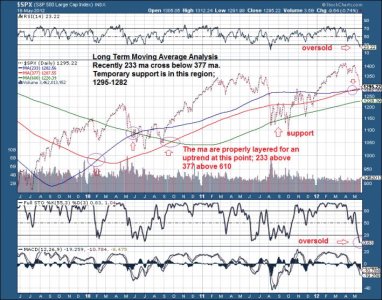
On the SP 500 chart, representing the TSP C fund, we see that in September, 2010 all three ma were properly layered for an uptrend, with 233 ma on top and 377 and 610 layered below. This is when Quantitative Easing 2 (QE2) was underway. In April, 2012 we see the 233 ma slipping below the 377 ma, just past the 1422 SPX high. The two moving averages are offering a two-layered support region between 1295-1282. If this breaks we see a fall back region at the 610 ma near 1228 that found support during the summer of 2011.

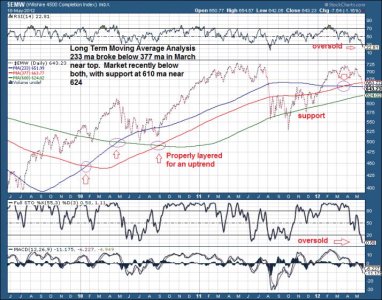
On the Wilshire 4500 chart, representing the TSP S fund, we see that the 233 ma broke below the 377 ma in March, 2012 near the highs. The market has pierced both of these moving averages and is heading for the 610 ma near 624. This is the area that found support during the summer of 2011. The long term uptrend is not in jeopardy yet, as long the 377 ma stays above the 610 ma.

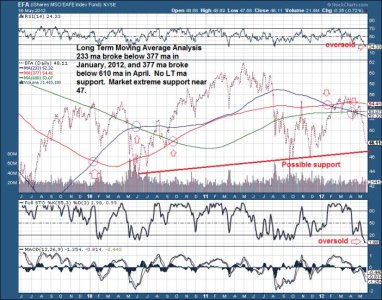
On the EFA chart, representing the TSP I fund, we see a major breakdown. The 233 ma broke below the 377 ma in January, 2012, and the 377 ma broke below the 610 ma in April, 2012. This is a bearish chart, as there is no long term average support. A possible extreme bottom trend line, with a higher low, points to the 47 area as a possible support and reversal zone. Europe is dragging down the US markets.

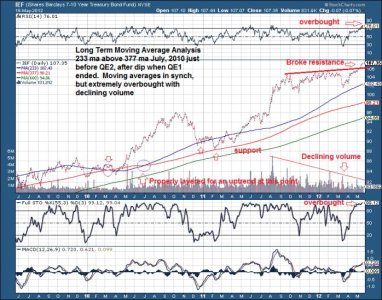
On the IEF chart of the 7-10 Year Treasury Bond, used here a surrogate for the TSP F fund, we see a properly layered chart for an uptrend, with a recent break of market resistance going back to September, 2011. This is a bullish chart that is extremely overbought. To reach the 233 ma this market would need to pull back to 102.43, which is not likely anytime soon. We do see declining volume however, so the market is getting extended to the upside. But also notice that the market can stay overbought (above 80) for long periods of time. The overbought reading on the Full STO is approaching 100, which is extreme, so I would expect a pullback soon.

In summary, based on this analysis alone the SP 500 should find support in the 1295-1282 area, the Wilshire 4500 in the 624 area, the EFA possibly in the 47 area, and the IEF (7-10 Year Treasury Bond) somewhere well above 102.43.
On the SP 500 chart, representing the TSP C fund, we see that in September, 2010 all three ma were properly layered for an uptrend, with 233 ma on top and 377 and 610 layered below. This is when Quantitative Easing 2 (QE2) was underway. In April, 2012 we see the 233 ma slipping below the 377 ma, just past the 1422 SPX high. The two moving averages are offering a two-layered support region between 1295-1282. If this breaks we see a fall back region at the 610 ma near 1228 that found support during the summer of 2011.

On the Wilshire 4500 chart, representing the TSP S fund, we see that the 233 ma broke below the 377 ma in March, 2012 near the highs. The market has pierced both of these moving averages and is heading for the 610 ma near 624. This is the area that found support during the summer of 2011. The long term uptrend is not in jeopardy yet, as long the 377 ma stays above the 610 ma.

On the EFA chart, representing the TSP I fund, we see a major breakdown. The 233 ma broke below the 377 ma in January, 2012, and the 377 ma broke below the 610 ma in April, 2012. This is a bearish chart, as there is no long term average support. A possible extreme bottom trend line, with a higher low, points to the 47 area as a possible support and reversal zone. Europe is dragging down the US markets.

On the IEF chart of the 7-10 Year Treasury Bond, used here a surrogate for the TSP F fund, we see a properly layered chart for an uptrend, with a recent break of market resistance going back to September, 2011. This is a bullish chart that is extremely overbought. To reach the 233 ma this market would need to pull back to 102.43, which is not likely anytime soon. We do see declining volume however, so the market is getting extended to the upside. But also notice that the market can stay overbought (above 80) for long periods of time. The overbought reading on the Full STO is approaching 100, which is extreme, so I would expect a pullback soon.

In summary, based on this analysis alone the SP 500 should find support in the 1295-1282 area, the Wilshire 4500 in the 624 area, the EFA possibly in the 47 area, and the IEF (7-10 Year Treasury Bond) somewhere well above 102.43.
