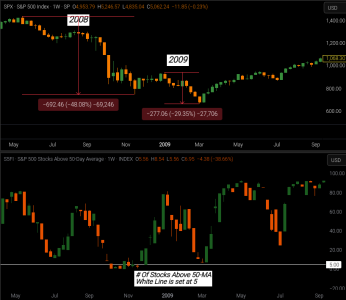
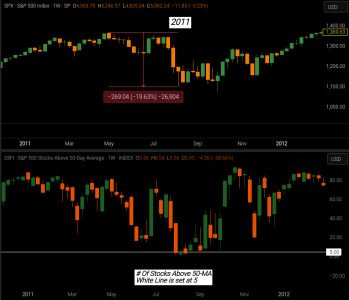
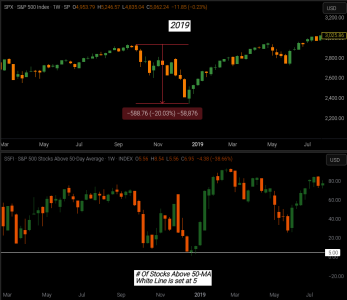
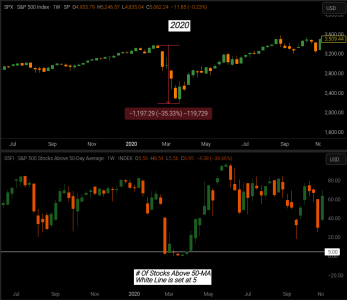
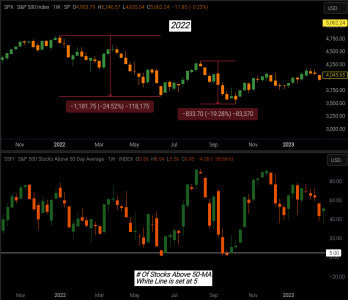
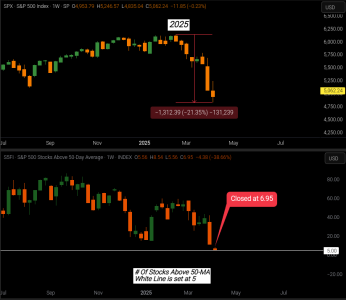
Listed below are examples of what's happened when the S&P 500 had 5 or less (of the Indexes 500 stocks) above their 50-day Moving Average.
The charts are in weekly form, but the data is based on daily. Generally speaking when levels get this low, we are within target of the key low, but 2008 took 7 weeks to bottom and 2020 took 6.
Upper chart is the index, the lower chart in the 50-MA Count.
The charts are in weekly form, but the data is based on daily. Generally speaking when levels get this low, we are within target of the key low, but 2008 took 7 weeks to bottom and 2020 took 6.
Upper chart is the index, the lower chart in the 50-MA Count.


