JTH's Account Talk

Shouldn't that be anything you can do I can do worse. :banana:

We just crossed standard deviation 4 on the 52-Week Linear Regression Channel. It's so rare I usually don't even bother to track it.
Including last week, a close below has happened 7 times in 63 years.

2025-03-31
2020-03-16
2020-03-09
2008-10-06
1994-03-28
1987-10-19
1987-10-12

In a normal distribution:
  • About 68% of data falls within ±1σ,
  • 95% within ±2σ,
  • 99.7% within ±3σ,
  • And ±4σ captures about 99.994% of the data.
 
The war continues...

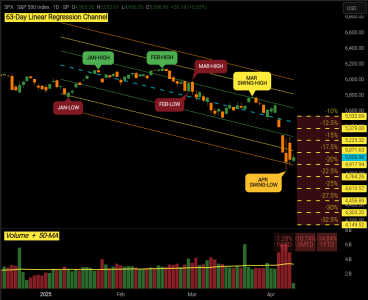
I have a simple plan, at 15% cash, I'm scaling in 2.5% cash for every -2.5% drop in the Index which means if we hit -32.5% I'm outta ammo.
I did take (and exit) some leveraged trades this month, it's been a great year, so I'm starting to lay of the throttle a bit. I plan to be 25% cash by year end.
 
There's an issue with my interpretation of the markets, but I haven't found a way to quantify it.

My perspective tells me this is a 2009/2019 event, but the current -21.35% drawdown doesn't match my expectations.
In reality, I don't think we've gone down far enough to match what my stats are telling me. Bottom line, I don't think we've hit the flush button yet.
We need more fear, a close below -20% to trigger the Bear Market Banner, we need folks bringing out the pitchforks, we need an additional catalyst, something to send the average passive investor running for the exit.

009.png
 
Last edited:
There's an issue with my interpretation of the markets, but I haven't found a way to quantify it.

My perspective tells me this is a 2009/2019 event, but the current -21.35% drawdown doesn't match my expectations.
In reality, I don't think we've gone down far enough to match what my stats are telling me. Bottom line, I don't think we've hit the flush button yet.
We need more fear, a close below -20% to trigger the Bear Market Banner, we need folks bringing out the pitchforks, we need an additional catalyst, something to send the average passive investor running for the exit.

View attachment 68761

Could be an event or labor. Labor is only thing holding things together. Just saw J.P. Morgan saying recession is likely. It’ll be long drawn out thing the longer these tariffs stay as is with a chance to morph into a crisis if it hasn’t already.


Sent from my iPhone using Tapatalk
 
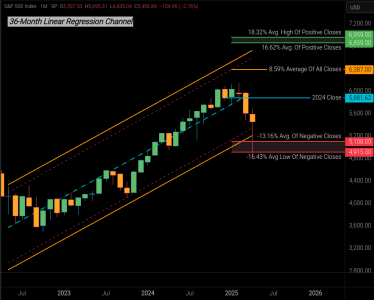
Monthly, 36-Month Linear Regression Chart

From Wednesday's Close the Monthly Tail (lower shadow) of the candlestick comprises 74% of the candlesticks body.
Statistically on it's own it's not relevant, nor does it imply future performance, but it is the 20th longest tail of 760 months.
If you believe we would close at this level, then you may also believe the tail will close in the Top 3% of 760 months.

The Orange Solid Line is Standard Deviation 3.
There have been 60 of 760 Monthly lows which pierced Standard Deviation 3-Support.
As is the case now, in 56 of those 60 months the LR-Slope was rising.
The average closing Monthly LR-Deviation of those 56 months is -2.47 at the Red-Dashed line or SPX 5313

006.png
 
Since I've been on a Linear Regression Kick lately, I thought you might enjoy some frivolous entertainment.
If you recall the Standard Deviations where price is expected to reside within these boundaries.
  • 1 σ (68.27%)
  • 2 σ (95.45%)
  • 3 σ (99.73%)
  • 4 σ (99.99%)
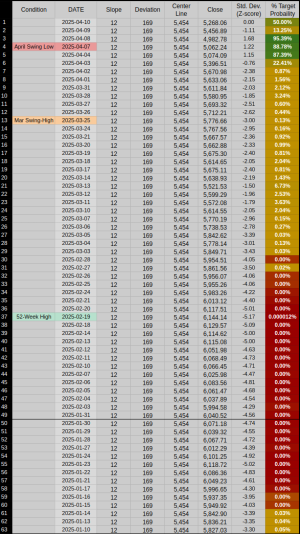
From Thursday's close, we can use 63-Day Linear Regression's, Slope, Deviation, and the Closing Standard Deviation, to calculate the probability of reaching the price of previous closes.

Row-4 Shows us prices have an 88.78% probability reaching the April Swing Low.
Row-13 Shows us prices have a .13% probability reaching the the March Swing High.
Row-37 Shows us prices have a 0.000012% probability reaching the 19-Feb 52-Week High

Of course this all based on the last close, so the data & probabilities evolve with each new session.
It's really just a rudimentary form of predictive modeling, but if I can expand its use across multiple timeframes, it could prove useful.

01010.png


For the record, the highest closing Daily 63-LR Std. Dev. I have on record is 4.22 from 1984

Screenshot_2025-04-11_18-18-09.png

Fk me I have to do my taxes...
 
Another glorious week of battle, let's talk about Thursday

Watch out! Friday is Good, which means Options Ex is this Thursday.
Of the lasts 12 Options Ex
___Last 6 of Pre1 (traditionally on a Thursday) closed negative.

Screenshot_2025-04-14_13-34-55.png


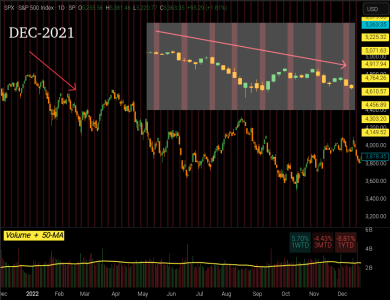
Speaking of Thursday, did you know the last 8 have closed down?

The last time this happened was... The Bull Market Peak of Dec-2021

009.png


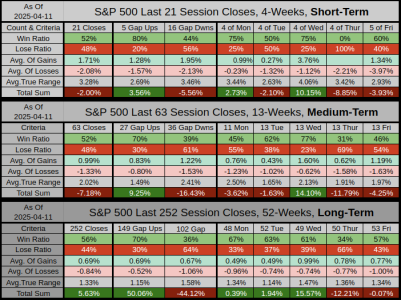
Over the past 252 Sessions, Thursday has a 34% win ratio with the largest DoW losses.

Screenshot_2025-04-14_14-01-44.png
 
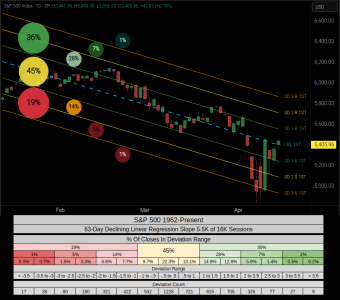
I had thought to myself that if a 63-Day Linear Regression Channel is Declining, then the majority of session closes would naturally gravitate towards the bottom half of the channel.

So I crunched the numbers, and it turns out I was wrong, the majority of session closes are in the upper half of the channel.
60.5% to be exact, I also found it interesting of 16k sessions, only 35% or 5.5K sessions were within a declining channel.

010.png
 
After the decline I had some leveraged positions, and last night decided to cut those losses.

It was a steeper than expected loss, because I was still running those positions under bull market conditions. I have position sizing rules for bear market conditions, but at the time those initial buys were made, we hadn't yet hit a correction. I'll still trade, just trade smaller under our present conditions.

That's the bad news, the good news, I'm now sitting at 36% cash.
 
Exciting times

IFT From 100G to 100C EoB today

I've been working a Quant AI system, it will never be finished, but I plan to start a thread and start displaying the results.

Working with AI is like ordering a Happy meal, all the ingredients are there, but not in the right proportions or structure.
The burger buns are upside down, the fries are all skin no potato, the ketchup is yellow, and the cola is all sugar.
So you take it back, demand a new meal with revised changes, and it finds a different way to screw it up.

Eventually you get to a point where you've confined it with so many rules, that it has no choice but to conform to your expected output.
Here's a sample on the weekly timeframe.

📈 Outlook — Week 17 Projection​


Bias: Upside Lean in Structurally Rising Environment
  • Projected odds:
    Gain: 55% | Loss: 45%
    Magnitude: +1.3% gain / −0.8% loss
  • Distance to 52-Week High: +13.2% → odds ~4%
  • Distance to 52-Week Low: −11.8% → odds ~6%
🕰 Seasonal Overlay — Week 17 Historical
  • Gain rate: 56%
  • Avg return: −0.04%
  • Rank vs all weeks: Top 26%
  • Rank in Q2: Top 29%
📌 Seasonal tone adds slight support, though historical gains are modest.


🪞 Historical Echoes (Rear View Driving)​

  1. 2016 Wk-16 — Structurally rising market w/ strong negative deviation
    → +2.2% gain the following week
  2. 2005 Wk-16 — Low volume OPEX week w/ deep FVG
    → +1.0% reflexive bounce next week
  3. 1974 Wk-16 — Steep slope, light volume, oversold candle
    → −0.5% follow-through to the downside

🧠 Historical echoes lean slightly bullish when dips occur in rising environments with compressed volatility.
 
Back
Top