JTH's Account Talk

Good morning

In Poland we are burning coal, and at times the air can get thick, so if Santa is coming to town, I probably won't be able see him :) For myself, I'm ready to put this year behind us and focus on performing better in 2023. Setting aside Sunday's bearish charts, here's the historical stats going into this week and next weeks post Holiday Monday. Have great week!

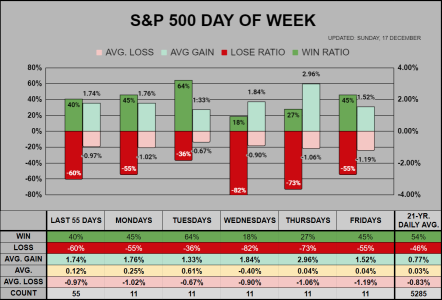
For the Day of the week chart, the last 55 days are still significantly below the 21-year daily average. Tuesdays have taken the lead as the clear winner, while Wednesday & Thursday are stinkers. Lastly, the last 4 Fridays have closed down.
20221217-DoW.png

___
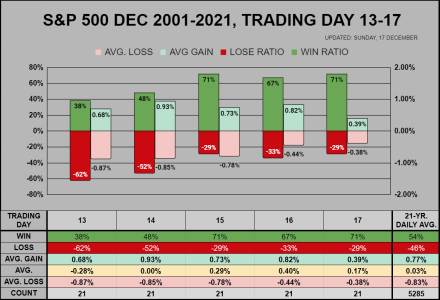
For trading days 13-17, days 15-17 look great, but day 17 has weaker than average gains/losses going into the market holiday.
20221217-TRD.png

___
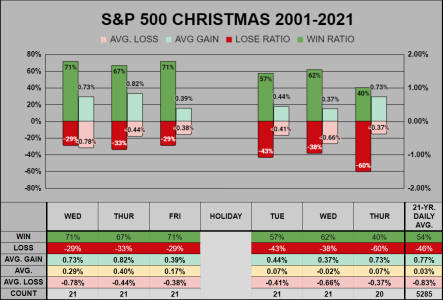
Here's the last 21 years surrounding the Christmas holiday. Three days prior looks good, post 2 days look good, from there (Thursday 29 Dec) the stats fade under the 21-year averages.
20221217-HOL.png
 
Good morning

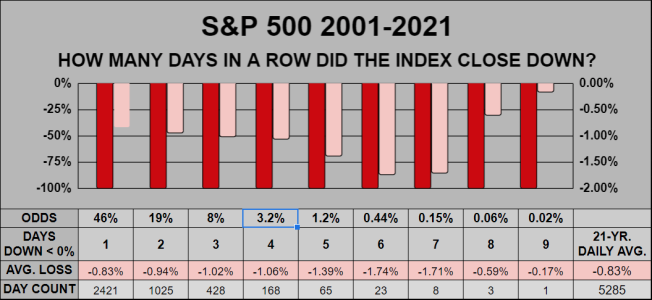
We're on our 4th day down. Already at the beginning of December we closed down 5 consecutive days, 6 times in October, 6 times in September, and 5 times in Jun/Jul/Jan.

Definitely not the statistical norm, this year alone (from Friday) over the past 242 trading days, the S&P 500 has a 43% winning ratio, vs the previous 21 year's 54% winning ratio.

20221127-ROW-.png
 
If we go higher from here then I may scale out as we re-approach the highs, otherwise I'll look to buy more lower next year.

2nd IFT this month, EoB today from 25G/75C to 10G/90C


SPX_2022-12-20_17-56-25.png
 
Good morning

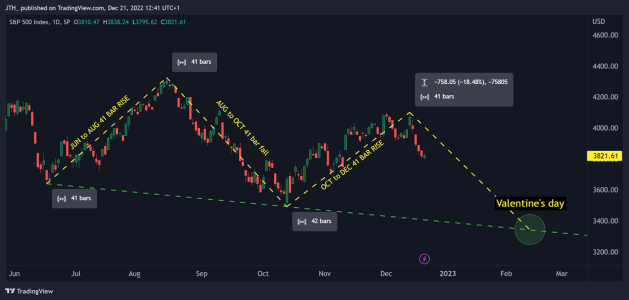
Symmetry works, until it doesn't. Here we show the S&P 500's 41 bar rise, 41 bar fall, & 42 bar rise. This price projection would entertain a breach of the October low, followed by a bounce off the box of chocolates.


symmetry.png
 
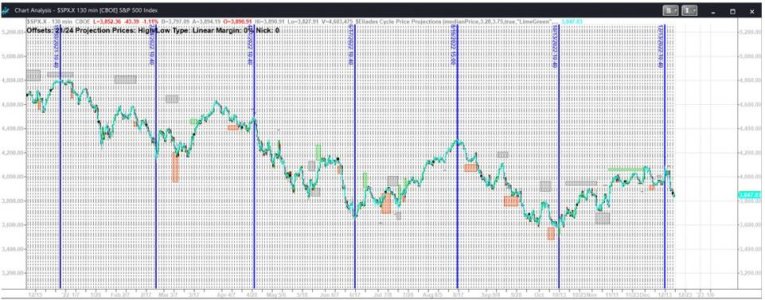
Nice chart JTH. That cycle in fact goes all the way back to the 4800 top. Last weekend I was playing around with 130-minute bars in TradeStation, which results in three bars per 6.5-hour trading day. I looked at the precise highs and lows since the all-time high at about 4800, and found a clear pattern. There was essentially a double top with highs for the S&P 500 on 12/30/21 (1[SUP]st[/SUP] bar of the day), and 1/4/22. I chose to start with the first high on the morning of 12/30/21, and zoomed in and counted the following number of bars to each high and low in 2022…

1. 114 bars to the 2/24/22 LOW (1[SUP]st[/SUP] bar of that day)​
2. 117 bars to the 4/21/22 HIGH (1[SUP]st[/SUP] bar of that day)​
3. 120 bars to the 6/17/22 LOW (1st bar of that day)​
4. 122 bars to the 8/16/22 HIGH (3[SUP]rd[/SUP] bar of that day)​
5. 121 bars to the 10/13/22 LOW (1st bar of that day)​
6. 125 bars to the 12/13/22 HIGH (1st bar of that day, and note that Black Friday had 2 bars, a shortened day)​

Note that the cycle has been lengthening by about 2 bars each time, on average, and also note that each cycle has been alternating as a high and then a low, no exceptions.
If this pattern continues, I’d expect the next low, which I think will be a major low and the bottom of a large wave A of the secular bear market that should last much of the 2020s, should come after about 127 bars on 2/14/2023, matching your chart exactly (or perhaps the last bar on 2/13/23). 127 bars happens to be the first bar on that Tuesday morning (a “turnaround Tuesday”?), and a monthly CPI report will be released that morning: https://www.bls.gov/schedule/news_release/cpi.htm It also will be exactly 3 years after the major top before the Covid-crash of Feb/Mach 2020. My only question is whether or not this cycle "inverts" and it ends up being a high instead of a low. Some gurus like Avi Gilbert are expecting a top at 4300+ around that time. Cem Karsan also expects a peak on that exact day. If it's a bottom (around 3200ish?), next should come a nice big wave B rally that lasts much of 2023, perhaps regaining about half of the bear market fall (so up to 4000ish), then the bear returns with wave C down. After that would come a wave “X”, then probably another set of ABC waves deeper into the 2020s. Just my musings, wish it was that easy LOL.

This is impossible to see since this chart fills my 32" monitor, but here's the full one-year view of the cycle...

2022 cycle.jpg
 
Nice chart JTH. That cycle in fact goes all the way back to the 4800 top. Last weekend I was playing around with 130-minute bars in TradeStation, which results in three bars per 6.5-hour trading day. I looked at the precise highs and lows since the all-time high at about 4800, and found a clear pattern. There was essentially a double top with highs for the S&P 500 on 12/30/21 (1[SUP]st[/SUP] bar of the day), and 1/4/22. I chose to start with the first high on the morning of 12/30/21, and zoomed in and counted the following number of bars to each high and low in 2022…
1. 114 bars to the 2/24/22 LOW (1[SUP]st[/SUP] bar of that day)​
2. 117 bars to the 4/21/22 HIGH (1[SUP]st[/SUP] bar of that day)​
3. 120 bars to the 6/17/22 LOW (1st bar of that day)​
4. 122 bars to the 8/16/22 HIGH (3[SUP]rd[/SUP] bar of that day)​
5. 121 bars to the 10/13/22 LOW (1st bar of that day)​
6. 125 bars to the 12/13/22 HIGH (1st bar of that day, and note that Black Friday had 2 bars, a shortened day)​

Note that the cycle has been lengthening by about 2 bars each time, on average, and also note that each cycle has been alternating as a high and then a low, no exceptions.

Thanks for adding to this, that's a great chart, I had not thought to go this far back, (and even so), I probably wouldn't have spotted this as it's not something I'm particularly talented with. But now that I know about this, I'm certain something different will happen... :)
 
Re: Sunday: Bears take the lead

Good evening

Found some S&P 500 lumpy coal in my stocking this year
:suspicious:

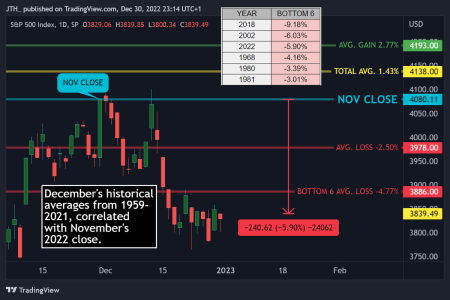
Down -5.90% for the Month, when compared to the previous 63 years, this was the 3rd worst December.

20221231-HIST-M.png

___
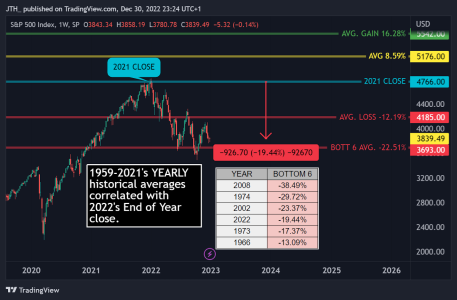
Down -19.44% for the year, when compared to the previous 63 years, this was the 4th worst year.

20221231-HIST-Y.png
 
Good morning (Post 1 of 3)

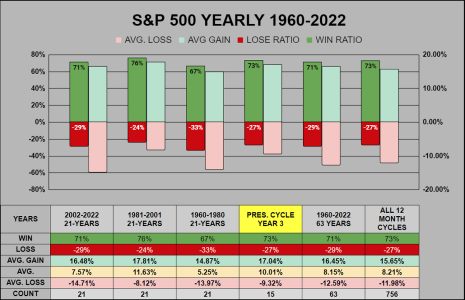
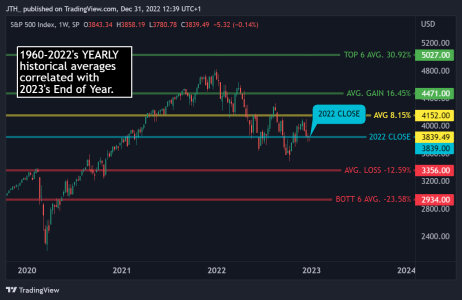
From 1960-2022, across these past 63 years, the average yearly gain is 8.15%

20230101-STAT-Y.png

___
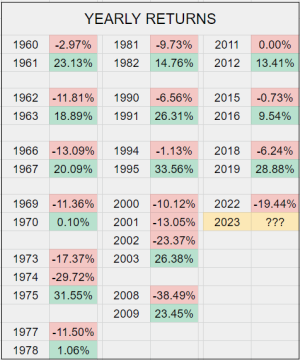
From the previous 14 occasions where the S&P 500 closed down for the year, it closed up the next year 12 times. In 1973 the index closed down a 2nd year, and in 2000 it closed down 3 years.

20230101-STAT-Y1.png

___
If I were to do a price projection for EoY 2023, I would estimate we are in a very similar predicament to 1973 & 2000, but since it's Presidential cycle year 3, I'll add some optimism. My uneducated guess is we will range as high as 4300 (Aug 2022 Peak) and as low as 3350 (Pre-Pandemic peak). That's a 22% price range to work around so I'm not exactly putting myself out on a limb with these price targets :)

20230101-HIST-Y.png

 
For the 1st Quarter (Post 2 of 3)

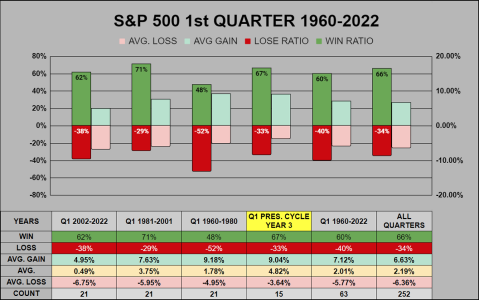
From 2002-2022, the previous 21 years have not been kind to Quarter 1 with a very low .49% average gain. This is partially due to 3 of the 4 biggest Q1 losses over the past 63 years occurring in the past 21 years, with 2020's pandemic Q1 losing -20%.

20230101-STAT-Q.png
___
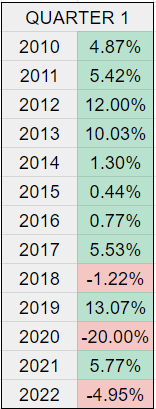
In addition to 2020's monster loss, 3 of the last 5 Q1s have closed down, but there was a nice 8 year Q1 win streak from 2010.

20230101-STAT-Q1.PNG
___
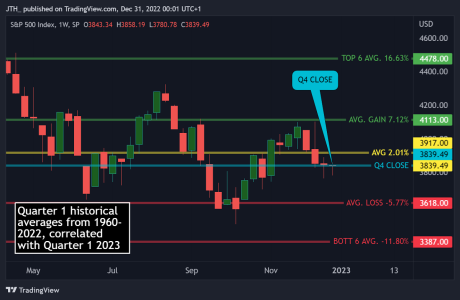
Based on Q1's historical averages, it looks to me that it would be reasonable to re-test October's low around the AVG. LOSS -5.77% level at 3618, then work our ways towards the AVG. 2.01% level at 3917.

20230101-HIST-Q.png
 
Lastly, for the Month of January (Post 3 of 3)

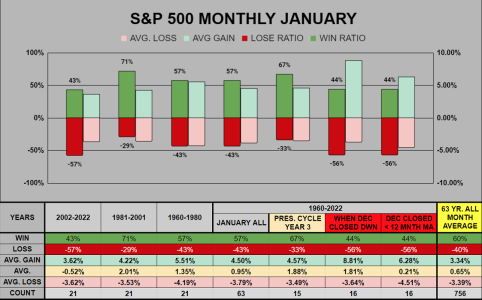
With an average of -.52% and a low 43% winning ratio, the past 21 Januaries have significantly underperformed the previous two 21-year timeframes. But sometimes when the stats are this low, then perhaps there's a greater chance of rebounding to equalize with the longer-term trend.

20230101-STAT-M-JAN.png


___
An interesting observation, over the past 15 Januaries, 3 down/up/down/up/down/...?

20230101-STAT-M1-JAN.png
___
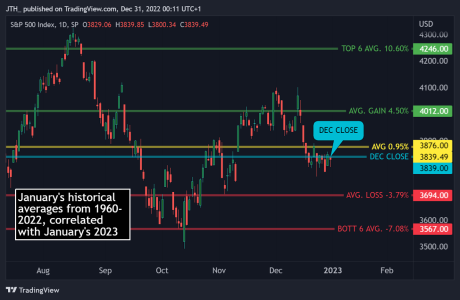
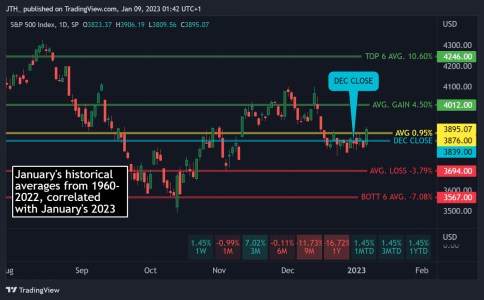
Using historical averages, it looks like we could test the AVG. LOSS -3.79% level at 3694 which is also November's low. For myself, this would be my preference, because outside of TSP, I'm over 20% cash and I'd like to get the pain out of the way early in the year and put some of that cash to work. Good luck!

20230101-HIST-M.png
 
Good morning

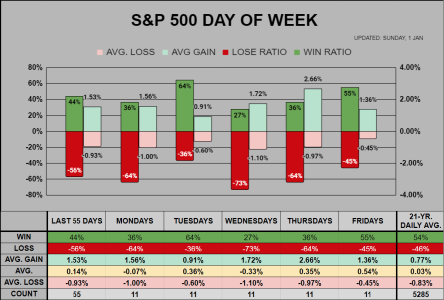
In the signature block below, I've updated the historical averages over the past 21 & 63 years, mostly to be used a a reference point. For the last 55 days, the win ratio is well below the historical 21-Year daily average. Meanwhile Tuesdays have been hot, while Wednesdays have been cold.

20230101-STAT-DoW.png
 
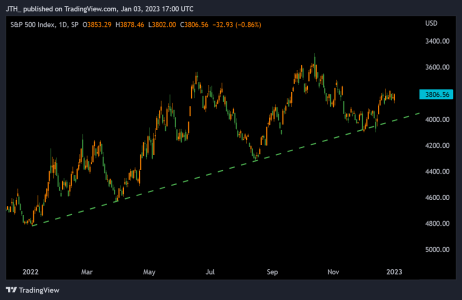
Here we have a clearly defined rising trendline on the S&P 500, the only problem is the chart is inverted...

20230101-CHRT-INV.png
 
Good morning (SPX 2-DAY performance is .35%)

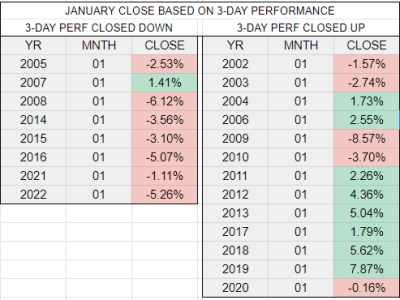
Today is the 3rd trading day of January. Over the past 21 years, the 1st 3-day performance of the S&P 500 closed down 8 times. Of those 8 occasions the month closed down 7 of 8 times. However when the 3-day performance closed up, the month closed up 8 of 13 times.

20230101-STAT-3-DAY.PNG
 
Good morning

At this moment, Jan MTD is up 1.45% this is above the 63-year historical .95% average of all end of month Januaries.

20220108-STAT-JAN.png


___
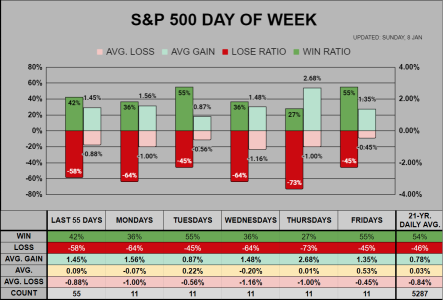
For the DoW chart, the last 55 days have a very low 42% winning ratio. For win ratios, TUE/FRI are average, while MON/WED/THUR are significantly below average.

20230101-DoW.png
 
Good morning

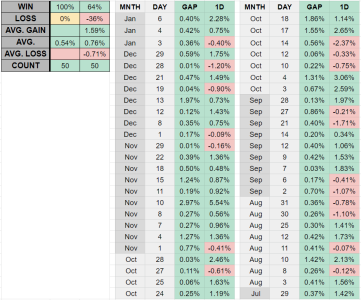
Today SPX gapped positive .46% at the open.

From last Friday, the previous 50 positive gaps have a 64% win ratio (for the close that day) with an average gain more than twice the average loss. The 2nd day (the day after) has a 44% win ratio following the previous day's positive gap.


20230101-GAP-50.png
 
Re: Sunday: Bears take the lead

Good morning

Fortunate to have exited above the 2 previous C-fund buys, as of today, I'm sitting 100G.

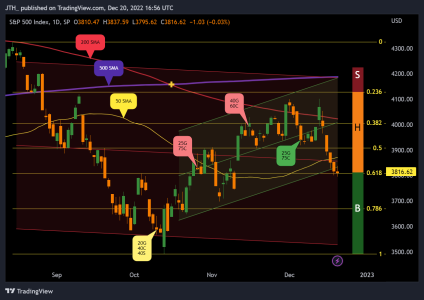
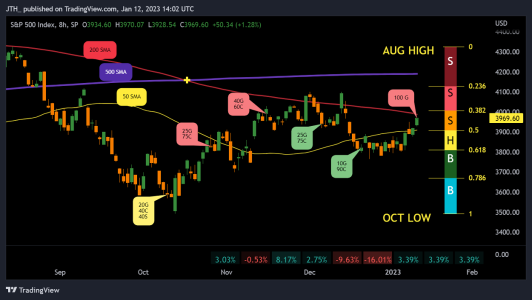
We do look to be getting ready for a 4th test of the 200 SMA (previous 3 failed), so perhaps the 4th time can carry us back to the NOV/DEC 4100 double top. As for myself, I'll wait for a lower entry, I certainly do not want to chase the rally I just exited, so I'll be cheering from the sidelines.
:banana:

20230111-IFT-CHART.png
 
Back
Top