JTH's Account Talk

S&P fire sale today! Getcha Hot Stocks right here, Get 'em while they're Hot, folks...

You aint seen Hot Stocks this cheap in the last 22 months!! :D
 
JTH: I haven't had a lot of success yet in 2016. I can't understand it because I'm using my "state of the market technology (or SMT)" for graphing and predicting oils impact on the market...

View attachment 36996

FS

Obviously an Graphic Representation of Chronic Frustration and that Beat-Down feeling.:aargh4: :chairshot: :buttkick::smashfreakB:

Have a Drink.

Relax. :trink26:
 
S&P fire sale today! Getcha Hot Stocks right here, Get 'em while they're Hot, folks...

You aint seen Hot Stocks this cheap in the last 22 months!! :D

I think you should revisit JTH's chart to see where we might be headed before you Get 'em while they're Hot! We should be close to some type of capitulation though. I exited 4Feb. with a 10% loss, so what do I know. Best of luck for those who have the stomach to Jump in.
 
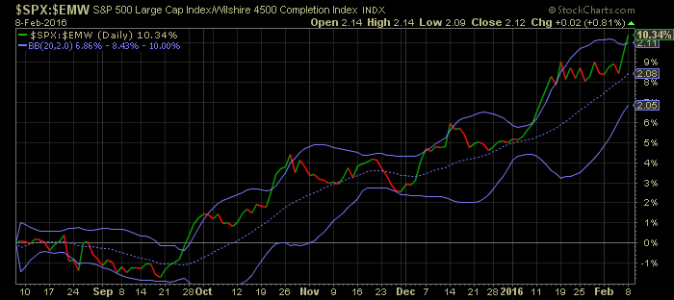
Looks like the performance of the C-Fund vs. S-Fund is breaking out of the channel (meaning the small caps are taking more of a beating (again))

sc.png
 
Sitting at close to -12% for the year.
The decision, for me, is easy. I'm going to pull a Birchtree. Let me know when the smoke clears.
 
Sitting at close to -12% for the year.
The decision, for me, is easy. I'm going to pull a Birchtree. Let me know when the smoke clears.

Down only -0.86% and close to retirement, I'll be joining you. Hell, I was up almost a point last week and should have bailed Wednesday last. Live and learn! :smile:

Best of luck to all those brave enough to continue to hold. But, I'm going to sit awhile.

Frank
 
I think you should revisit JTH's chart to see where we might be headed before you Get 'em while they're Hot! We should be close to some type of capitulation though. I exited 4Feb. with a 10% loss, so what do I know. Best of luck for those who have the stomach to Jump in.

Twas a bit o' sarcasm, me lad.
 
Good evening

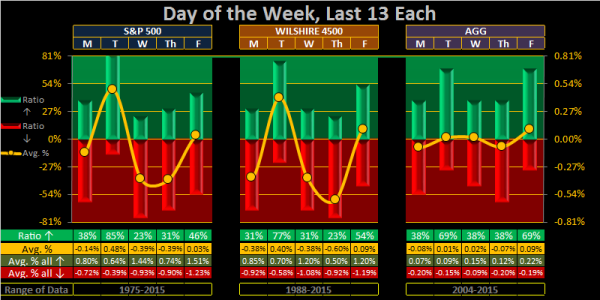
I'm not trying to throw some shade here, but I would like to point out IMHO Tuesday is the best day to exit (not enter)

Posted from my Week 5 Blog
2016 - Week 05 - Daily - DoW.png
 
Good evening

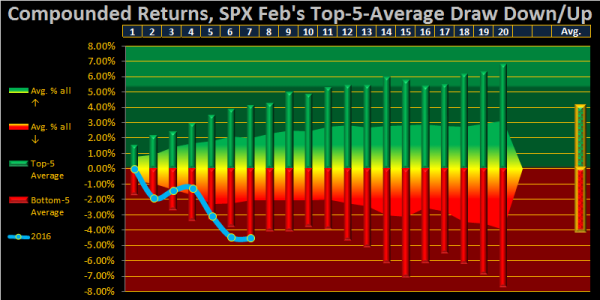
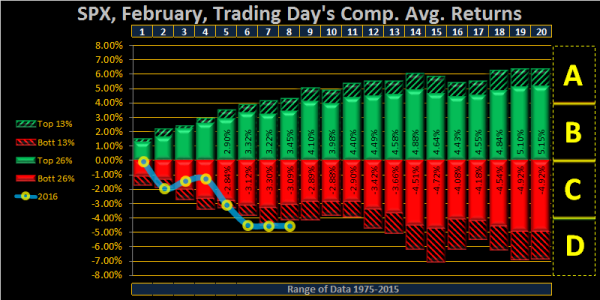
I don't post charts like this very often because they are difficult to explain.

This a COMPOUNDED chart for Feb, meaning for each year, the returns for each day is added to the next.

1) BAR CHART: Take the compounded average of the top/bottom 5 days, for each trading day across the past 41 years and this gives you the outer edge of potential returns.
2) AREA CHART: Measures the compounded all up/down returns, showing a typical month's tips & dips.
3) The blue line is where we are within Feb 2016, showing we are on the outer edge of the statistical dip.

Perhaps you'll find it useful as a means to understand where we are within the bearish part of the historical stats...or not :banana:

2016-06-D-MISC2.png
 
There is nothing wrong with your browser. Do not attempt to adjust the URL. We are controlling transmission. We can increase the brightness, we can adjust the contrast. We can reduce the focus to a soft blur, or sharpen it to crystal clarity. We will control the horizontal. We will control the vertical. For the next hour, sit quietly and JTH will control all that you see and hear. You are about to experience the awe and mystery which reaches from the inner mind to... The Market's Outer Limits :cheesy:
 
There is nothing wrong with your browser. Do not attempt to adjust the URL. We are controlling transmission. We can increase the brightness, we can adjust the contrast. We can reduce the focus to a soft blur, or sharpen it to crystal clarity. We will control the horizontal. We will control the vertical. For the next hour, sit quietly and JTH will control all that you see and hear. You are about to experience the awe and mystery which reaches from the inner mind to... The Market's Outer Limits :cheesy:

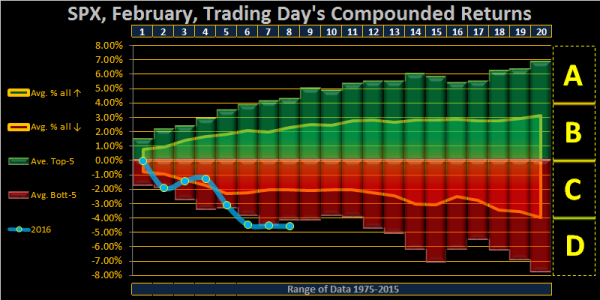
Here's the latest incarnation of the chart.

Based on historical data vs. 2016's current path, I'd estimate we'll close in the bottom of zone C at -3.81%

2016-06-D-MISC3.png
 
So which one of you is gonna jump in first...

Well...that's real Purdy, but I don't understand too well. Me...I just go to a certain thread,

Looks like preliminary bottom-fishing/knife-catching with no conviction. I'm staying out.

And do the opposite! :)
 
It ain't over until it's over, Calling a Bottom is way to hard for me to try doing that again.
 
Thanks

1) Take the 786 closes from Feb (Last 41 years)
2) Compound them by trading day per each year
3) Filter them by Top/Bottom categories, then average those out

Here's the latest version, showing we are under the Bottom 13% over the past 41 years (at its current position)

2016-06-D-MISC4.png
 
Back
Top