JTH's Account Talk

minus 3% then plus 3% intraday to break even with no way to trade it in our time-delayed tsp accounts? that bites. i hope that wasn't the relief rally right there. does anybody have a good reason why the market changed course or is it just magic?

Not sure if this is the reason, but the February contract for oil expired and the March contract kicked in. The February contract closed at 26. something and the March contract opened at 28. something. The market is tied to oil, so when oil went up, the market went up...at least that's the explanation I got on FBN. :D
 
but as of the close today I've more than tripled my trading account in just the first 3 weeks of 2016, and it's not a tiny account, it's in the six figures now.

Tripled your account in three weeks? Impressive. That's going to result in a hefty tax bill, but you will have the capital gains to pay it.
 
Tsunami, I share your view on the down side and hope you are right about being on wave 2 up to the 2000 level. I would like to hear more about how you are structuring your options trades. I tried to trade options last year and found they can move against you in a flash. I never figured out when I needed to sell them or cover the trades. Please keep us updated on your Elliot wave projection and any changes that you see over the next few weeks. The levels to look for are very useful for those of use that don't have the knowledge or experience of the more advanced traders. Thanks for your input.
 
WARNING TSP made me setup 5 security questions, which sucked up some valuable IFT deadline time.

IFT EoB today from 100S to 100C
 
Thanks for letting us know. Hope you are well in Europe. Any chances to sightsee????

Haven't left the city much, but I can tell you it's very cold, sort of reminds me of the years I lived in Alaska. I did a 15km trek with some friends on a cold winter morning, walking on solid ice the whole time, there's nothing funnier than watching your friends fall down...
 
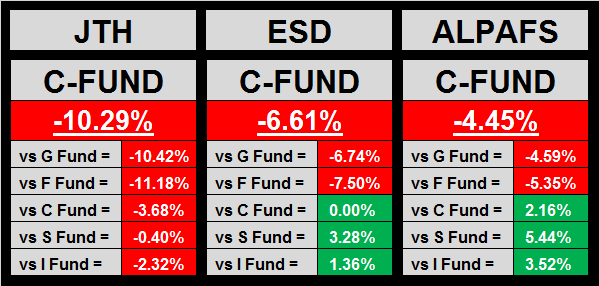
This makes sense, I enter the C-Fund and today the S-Fund is now outperfroming...

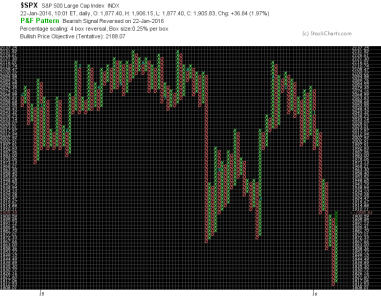
Anyways, both the SPX, TRANS & NASDAQ 100 have put in bullish reversals today, W4500 is not far behind.

SharpChartv05.png
 
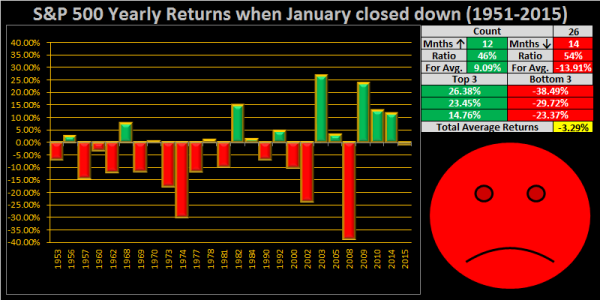
Well, at least 5 of the last 7 negative January's ended in a positive year... Much higher percentage than the years long ago, it's a new age we live in now.

i also read that although the majority of negative January years ended negative, half of those were positive from February through December... So hopeful...
 
Not to be Debbie Downer, but I think that if you consider 2016 to be at the beginning of a bear market (as I do, but many don't believe that yet), then it's best to compare 2016 to similar years in that chart...like 1973, 2000, and 2008. So in that case the best performance was down more than 10% for the full year. If we bottom sooner than October-ish though (and I think a bottom as soon as April is possible), then this could easily end up being a positive year.
 
Not to be Debbie Downer, but I think that if you consider 2016 to be at the beginning of a bear market (as I do, but many don't believe that yet), then it's best to compare 2016 to similar years in that chart...like 1973, 2000, and 2008. So in that case the best performance was down more than 10% for the full year. If we bottom sooner than October-ish though (and I think a bottom as soon as April is possible), then this could easily end up being a positive year.


I think you need to watch this:
http://www.tsptalk.com/mb/market-vi...al-analysis-videos-post528951.html#post528951
 
Well, at least 5 of the last 7 negative January's ended in a positive year... Much higher percentage than the years long ago, it's a new age we live in now.

i also read that although the majority of negative January years ended negative, half of those were positive from February through December... So hopeful...

Not to be Debbie Downer, but I think that if you consider 2016 to be at the beginning of a bear market (as I do, but many don't believe that yet), then it's best to compare 2016 to similar years in that chart...like 1973, 2000, and 2008. So in that case the best performance was down more than 10% for the full year. If we bottom sooner than October-ish though (and I think a bottom as soon as April is possible), then this could easily end up being a positive year.

Not going to argue either point when I believe both cases are valid.

I do believe front-weighted (more recent) statistics are more relevant than older data, this is the key reason I tend to post SPX data from the past 41 years vs. the previous 65 years.

At the same time, I do believe we are in an official Bear Market, I don't care if the S&P 500 has only dropped -16% instead of the traditional -20%, especially when I see the TRAN & small caps have already dropped much lower.

I don't think it will be another 2007-2009, but it will be a stall that I view as a good buying opportunity for those who have the cash to swoop up rock-bottom prices...


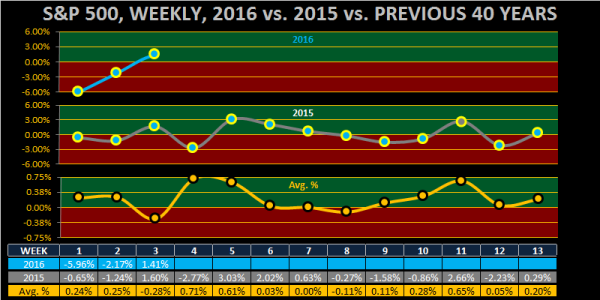
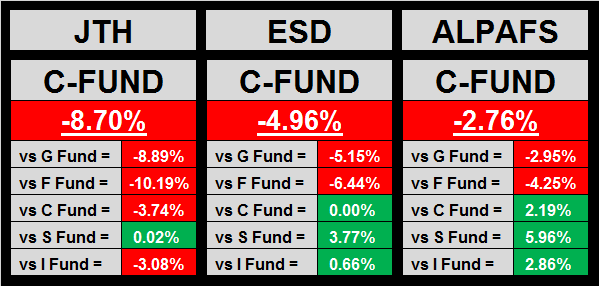
Trading the Stats:***February, Week 5, Part 1/2***February, Week 5, Part 2/

2016 - Week 05 - JTH.png
 
Back
Top