JTH's Account Talk

Re: PRE VS. POST IFT

Thanks JTH - You've been a "Buy and Hold" for a while and I admire that strategy.

Serious question, do your charts indicate that this a good time of year for the buy and hold investor?

The first I have ever mentioned "Buy and Hold" and you eject to G Fund. It's like saying "Frau Blucher" in Young Frankenstein, just something one shouldn't say I suppose.

No worries, I've been slowly getting tuned back into the markets, I wasn't buy & holding, just ignoring the carnage of my under-performance :D

I'm just taking some gains off the table, I'll regroup and be back in this month :)
 
Hey buddy what's up!

I'm aware of the statistical cycles for presidential years, I've read about them in the Trader's Almanac, but have not spent much time analyzing them.

Reason being, I don't track the DJI which goes back much further than my SPX data (which for me, goes back to 1950).

Using the S&P 500, this leaves us 15 Presidential cycles going back to 1952 I can't use 2012-2015 because the data isn't yet written.

Looking at the data, for October, year 3 appears to have an edge over the other years, but with so few data points, the results could easily be skewed

View attachment 35455
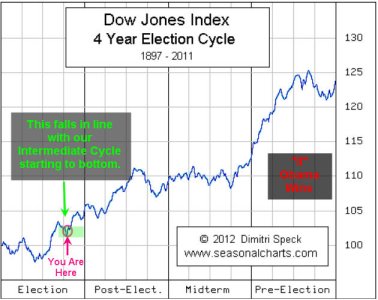
Thanks for getting that together. I just got interested in them a few years ago when I found this chart.

Its not too good for short term analysis but not bad to get a general direction. The movements in the market seem to match pretty close but the timing can be off quite a bit. Say a month or so. Its just the average over time.
 

Attachments

  • DowStocksElection.jpg
    DowStocksElection.jpg
    61.9 KB · Views: 222
Re: PRE VS. POST IFT

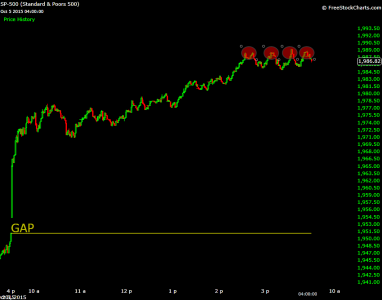
1 Minute chart shows a gap at the open and 4 failures to confirm a close above 1988

001.png
 
IFT EoB 5-Oct-2015, 100G
So with your exit today are you saying we won't continue higher after a breakout of the price range? Is this a Three Soldiers pattern and the movement is down with a higher open. Just wondering because I was expecting shorts to cover like tomorrow. Just thought I would ask the Chartman::blink:
 
So with your exit today are you saying we won't continue higher after a breakout of the price range? Is this a Three Soldiers pattern and the movement is down with a higher open. Just wondering because I was expecting shorts to cover like tomorrow. Just thought I would ask the Chartman::blink:

Hi BQ

Today's exit does not imply the markets won't go higher, I was able to watch the markets and felt confident we would finish the day with a solid close, so I chose to book profits.

Something else to consider, over the past 16,540 trading days, the S&P 500 has closed 5 consecutive positive days only 4.50% of the time, and 6 consecutive positive days only 2.45% of the time.

I'll be looking to get back in under 1960, we'll just have to see if it works out.

I wouldn't call it a textbook Three White Soldiers Pattern, it's more of a hybrid with the 1-Oct serving as a "pause" day. Either ways, there is serious strength behind the recent upwave :)
 
Hey buddy what's up!

I'm aware of the statistical cycles for presidential years, I've read about them in the Trader's Almanac, but have not spent much time analyzing them.

Reason being, I don't track the DJI which goes back much further than my SPX data (which for me, goes back to 1950).

Using the S&P 500, this leaves us 15 Presidential cycles going back to 1952 I can't use 2012-2015 because the data isn't yet written.

Looking at the data, for October, year 3 appears to have an edge over the other years, but with so few data points, the results could easily be skewed

View attachment 35455

PRE-PRESIDENTIAL ELECTION YEARS NO LOSERS IN 76 YEARS Investors should feel somewhat more secure going into 2015. There hasn't been a down year in the third year of a presidential term since war-torn 1939, Dow off 2.9%. The only severe loss in a pre-presidential election year going back 100 years occurred in 1931 during the Depression.

Hirsch, Jeffrey A. (2014-09-24). Stock Trader's Almanac 2015 (Almanac Investor Series) (Kindle Locations 417-420). Wiley. Kindle Edition.

REPOST: Had to redo the Presidential Cycle chart, it was off by a significant margin

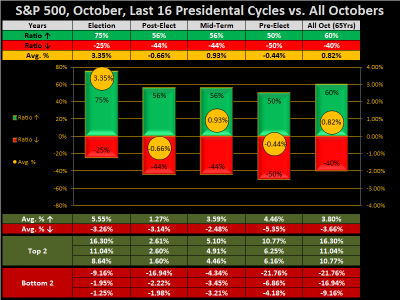
Using 16 presidential cycles, across the S&P 500, in October, election year is the strongest month, while pre-election year (2015) is the weakest. Bear in mind this is for the month of October, not the entire year (as referenced by the Stock Trader's Almanac above).

2014 - Mnth - Presidential Cycles.png
 
Re: PRE VS. POST IFT

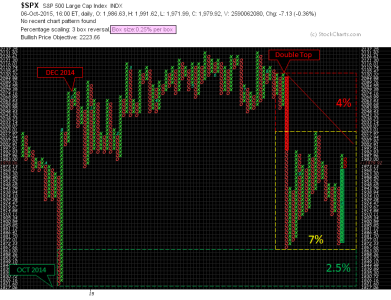
ALPAFS moves over the the G-Fund, for the most part, the downtrend is broken, but we've yet to establish an uptrend.

001.png
 
Re: 4th QUARTER

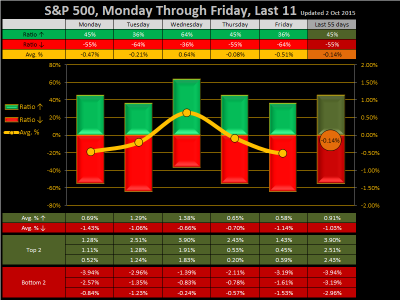
Wednesday is Hump day :)

Wednesday is the best performing day of the week, with a 64% winning ratio and .64% average gains

Friday is the worst performing day of the week with a 36% winning ratio and -.51% average gains

2014 - Daily - DoW.png
 
Re: 4th QUARTER

JTH, nice exit yest. and good of you to inform ahead of time and state your reasoning. Wish you well.
 
Re: PRE VS. POST IFT

Good evening

I've rebuilt the JTH-ESD system (Evolving Statistical Data)

We are entering a dead zone, so the system will leave the S-Fund and enter the G-Fund EoB Wednesday.

From there, the system will re-enter the S-Fund EoB Friday and remain there for the rest of October.

For JTH-ALPAFS (Advanced Logarithmic Point And Figure System)

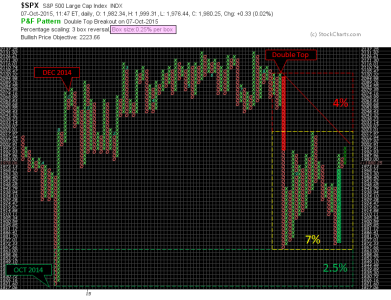
The S&P 500 has created a higher high X-column, has created an O-column, but has yet to establish a higher low O-column, thus we have a minor outside trend. If the index can create a higher low O-column, then it will establish a minor uptrend with a higher high/low.

001.png
 
Re: PRE VS. POST IFT

Jason, did I understand you correctly? JTH-ESD is only stepping out for 2 days (this Thur & Fri) and then back in? That doesn't sound long enough to make much of a difference unless your system really does know the future. :D

Are you trying to avoid the pre-holiday effect? I didn't think Columbus Day was one of the big ones.
 
Re: 4th QUARTER

Beautiful charts JTH. Easy to read and understand. Speaks to great communications skills.You should be an teacher.

FS
 
Re: 4th QUARTER

Beautiful charts JTH. Easy to read and understand. Speaks to great communications skills.You should be an teacher.

FS

Thank you FS, that is very kind of you to say :)

Jason, did I understand you correctly? JTH-ESD is only stepping out for 2 days (this Thur & Fri) and then back in? That doesn't sound long enough to make much of a difference unless your system really does know the future. :D

Are you trying to avoid the pre-holiday effect? I didn't think Columbus Day was one of the big ones.

Hi Cactus

ESD was offline the last few months, it was in the S-Fund, and this is the best path for it to take for the remainder of the month. It does not project future prices.

ALPAFS

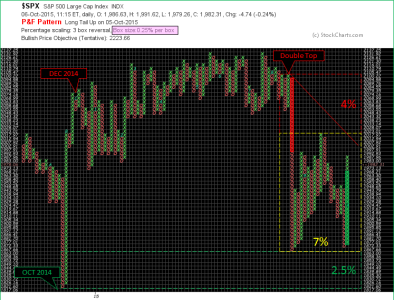
With a fresh Double Top Breakout S&P 500 has now established a higher O-column, but it's very shallow, this is a "judgement call" it will stay in the G-Fund.

001.png
 
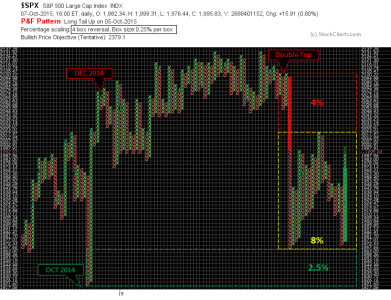
ALPAFS has switched over to a 4-box reversal system, this serves the purpose of smoothing out reversals, and eliminating columns with 3Xs & 3 Os. As a result, the previous column of Os is now removed and we now have a Long Tail Up, which on the scale means the most recent column of Xs have created a 4% (or greater) move.

S&P 500: Bullish w/Triple Top Breakout (5 Oct) w/Long Tail Up

W4500: Bullish w/Double Top Breakout (7 Oct) following a previous Long Tail Up

Transports: Bullish w/Double Top Breakout (5 Oct) now resting at a Double Top (following a previous Long Tail Up)

NASADAQ 100: Bullish w/Double Top Breakout (5 Oct) now resting at a Double Top (following a previous Long Tail Up)

001.png
 
Re: PRE VS. POST IFT

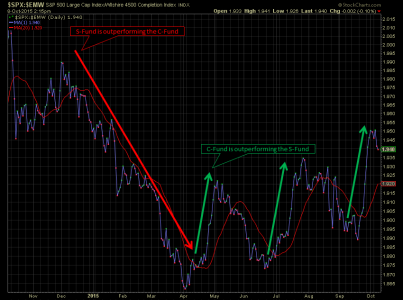
Simple comparison chart of the S&P 500 vs. the Wilishire 4500, shows a performance gap between the 2 indexes. Based on this chart, I would conclude the S-Fund has some catching up to do.

001.png
 
Re: PRE VS. POST IFT

Wow, Thx for the chart JTH.  With your arrows drawn, those up-down-(Repeat) patterns for both funds look so symmetrical since APR'15 in both amplitude and period.... barring some other cyclical or coinciding other factors, I'd suspiciously guess that somebodies with great influence/ leverage have made a lot of money since then going long then short (repeat) with good timing (?).<br><br>
Simple comparison chart of the S&P 500 vs. the Wilishire 4500, shows a performance gap between the 2 indexes. Based on this chart, I would conclude the S-Fund has some catching up to do. <br>
<br>
View attachment 35515
<br>
<br>
 
Back
Top