JTH's Account Talk

Your in the money today with your 100% C - I probably used my 2-3 lucky timing moves for year and now fear sets in, I'll freeze like Permafrost in the Arctic Circle while everyone else flys to the moon.

help me. :cheesy:

I don't think you need my help, you're doing just fine, much better than most folks :)

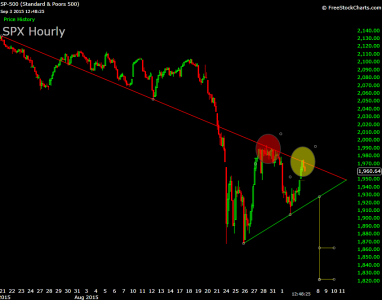
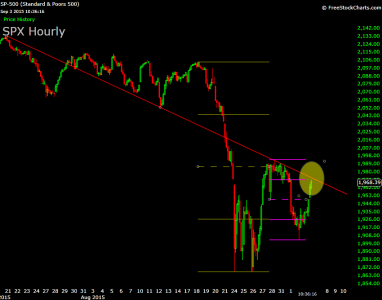
I'm watching for a test of the red trendline...
005.png
 
So the red line begins at the historic high?

very good analysis!

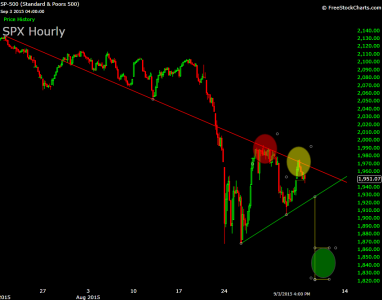
That is correct, it starts at the 20 July top, we've already failed to breach this line at the red circle, and what we do within the yellow circle deserves some caution, it looks like a classic bearish pennant, but you could also argue a case for a bearish Head & shoulders, with an 1820-1860 price objective. It's high risk to be playing at these levels...

006.png
 
Watching this with much interest. If market bottoms around 1920 today (& not lower) could the so called post holiday rally start sometimes today?? And if so will that descending red line act as resistance assuring only a brief recovery?

Which would lead to massive break down in the 1850-1820 range...

Don't wanna buy a sucker's rally... Hum.
 
And what would serve as the catalyst to breeze past the red resistance line??

Threes a Charm?? :stooges:

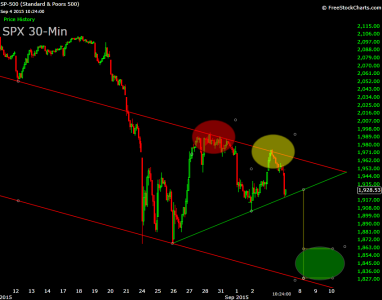
I would suspect we'll need to shake out more sellers with a "fakeout" breach of the green trendline, creating a vacuum of space for the buyers to occupy. From there we could make a run for the red trendline, perhaps on Tuesday.

008.png
 
Of course the shake up or shakedown! wont occur until after 12:00 that's why I love TSP.... :censored:

TA DA!!
 
I really appreciate the technical analysis here. Just looking at the news cycle for a moment, the fact that the China markets are closed this week is important, imo. When they open Sunday evening I'm guessing they will be free to tumble, and if it's a lot we may follow on Tuesday.
 
I really appreciate the technical analysis here. Just looking at the news cycle for a moment, the fact that the China markets are closed this week is important, imo. When they open Sunday evening I'm guessing they will be free to tumble, and if it's a lot we may follow on Tuesday.

Very nice thinking MrBowl. I like your thoughts here. I will extrapolate further into the future and say within the next 48 days...we will have seen intraday S&P 1625. That is the day the stock market left me in the dust and the day that I remembered I had to remember was the crash point in which to go back in with some dry powder. Seriously, that is a realistic reentry long term market point for me. Until then, play the trader moves...don't get burned. I figure that S&P 1625 forecast is about 65 percent probability of occurring.

Market shorterm traders will create great volatility over the next 45 days and in the end will have caused great confusion among investors and a tragedy for the buy and hold investors. Friends don't let friends buy and hold during bear markets. :worried:
 
I really don't like to disagree with the majority of the forum, but I don't believe any of this is as awful as folks think it is. We are still in "correction" territory, when I see large declines, I see opportunity, the opportunity to advance your accounts by years instead of months...

009.jpg
 
Very nice thinking MrBowl. I like your thoughts here. I will extrapolate further into the future and say within the next 48 days...we will have seen intraday S&P 1625. That is the day the stock market left me in the dust and the day that I remembered I had to remember was the crash point in which to go back in with some dry powder. Seriously, that is a realistic reentry long term market point for me. Until then, play the trader moves...don't get burned. I figure that S&P 1625 forecast is about 65 percent probability of occurring.

Market shorterm traders will create great volatility over the next 45 days and in the end will have caused great confusion among investors and a tragedy for the buy and hold investors. Friends don't let friends buy and hold during bear markets. :worried:
I figure that S&P 1625 forecast is about 40 percent probability of occurring and 1823 has a 60% percent of occurring. My guess.:notrust:
 
I would suspect we'll need to shake out more sellers with a "fakeout" breach of the green trendline, creating a vacuum of space for the buyers to occupy. From there we could make a run for the red trendline, perhaps on Tuesday.

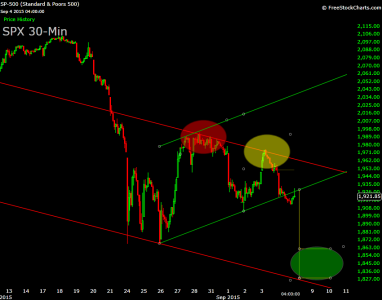
Good finish for the week, perfectly primed to head either direction...

010.png
 
100% possibility of seeing: 1,921.85, eh?

Yes, absolutely! The million dollar question is how do we get there?

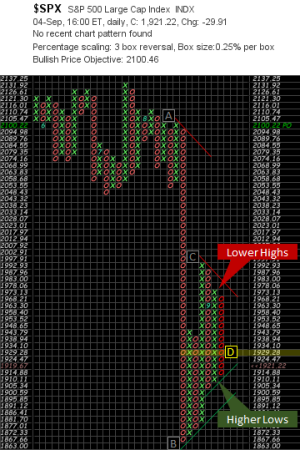
I believe the PNF .25% box chart illustrates this price action perfectly.

- Across wave AB we are bearish and it's fairly obvious

- Across wave BC, 50% is at 1930, so anything below that price I'd consider to be bearish

- The chart patterns look setup for awesome bearish price action, but it's so obvious, I'd rather go contrarian

011.png
 
Yes, absolutely! The million dollar question is how do we get there?

I believe the PNF .25% box chart illustrates this price action perfectly.

- Across wave AB we are bearish and it's fairly obvious

- Across wave BC, 50% is at 1930, so anything below that price I'd consider to be bearish

- The chart patterns look setup for awesome bearish price action, but it's so obvious, I'd rather go contrarian
Is that a definate maybe?
 
Pre-open buying to S&P 1960 and BAM - JTH's Red line! If it cant go above that Look out below and least we aren't following China like the Euros are...let the US market lead the way! Down!

I'll see all you eager buyers at 1830 then we will make some real money, eh?
 
Back
Top