JTH's Account Talk

Markets are pulling back further than expected, to make me happy...


AGG - Need a close down, below the 110.46
SPX - Need a close above 1046
W4500 - Need a close above 1084
Tran - Need a close above 8913
NDX - Need a close above 4324

Very-short-term, thus far, it's not looking good, NDX is stumbling, oil has gaped down, while the dollar has made new highs. It's still early in the day, perhaps we can get a better close.
 
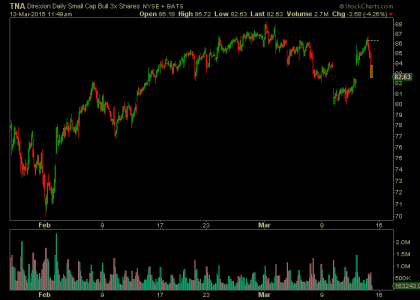
TNA is tanking, I'm going to take another bite and ride it over the weekend, in at 83

sc.png
 
Was late to the ETF game Thursday because I slept in. I have 2 orders in for DIG @ 46.80 and TNA @ 86.48

TNA is tanking, I'm going to take another bite and ride it over the weekend, in at 83

Another entry into DIG at 46.73

Poor execution this morning caused me to work a bit harder than usual, what should have been a profitable day, was a break-even day. The good news is I've now executed 25 trades, which means my cost basis is reduced from $8.95 to $5.95 so going foward from here, my trading edge is significantly reduced. I really need to trade more, there is no excuse for flawed executions, had I taken the trades at the levels I intended, it would have been a very good day. Chalk it up to the cost of learning...

Both TNA positions equalize to 84.74 the position is still open and is currently down -.27%

Both Dig positions equalize to 46.79 the position is still open and is currently down -1.08%
 
Markets are pulling back further than expected, to make me happy...


AGG - Need a close down, below the 110.46 (Closed @ 110.35)
SPX - Need a close above 1046 (Closed @ 2053)
W4500 - Need a close above 1084 (Closed @ 1089)
Tran - Need a close above 8913 (Closed @ 8945)
NDX - Need a close above 4324 (Closed @ 4314)

Very-short-term, thus far, it's not looking good, NDX is stumbling, oil has gaped down, while the dollar has made new highs. It's still early in the day, perhaps we can get a better close.

And a better close we did get

With the exception of NDX, the other indexes closed at the levels I wanted, so it was in fact a very good day
 
Trading the Stats: Week 11

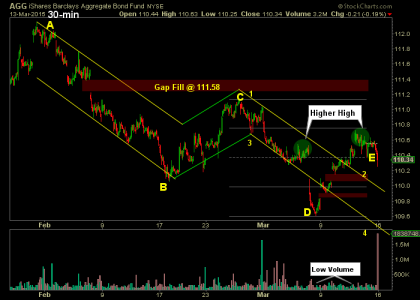
Check out the last 30-min sell-off in AGG, displaying the highest volume over the past 3 months.

2015-03-15 - 06.png
 
Poor execution this morning caused me to work a bit harder than usual, what should have been a profitable day, was a break-even day. The good news is I've now executed 25 trades, which means my cost basis is reduced from $8.95 to $5.95 so going foward from here, my trading edge is significantly reduced. I really need to trade more, there is no excuse for flawed executions, had I taken the trades at the levels I intended, it would have been a very good day. Chalk it up to the cost of learning...

Both TNA positions equalize to 84.74 the position is still open and is currently down -.27%

Both Dig positions equalize to 46.79 the position is still open and is currently down -1.08%

JTH,

I had read your explanation some time ago regarding your small trades that allowed you to meet your compliance with your broker to trade at 5.95/trade. I commend you for your disciplined approach in all. Who is your broker? I didn't quite understand the problems you had yesterday with the limit order and would like to learn how to avoid future mistakes in my own account.

Did you buy two sets of TNA and Dig at different prices? When you say that both TNA positions equalize to 84.74, is this the same as saying that you averaged 2 prices by dividing the sum by 2? Thanks in advance for your clarification.
 
JTH,

I had read your explanation some time ago regarding your small trades that allowed you to meet your compliance with your broker to trade at 5.95/trade. I commend you for your disciplined approach in all. Who is your broker? I didn't quite understand the problems you had yesterday with the limit order and would like to learn how to avoid future mistakes in my own account.

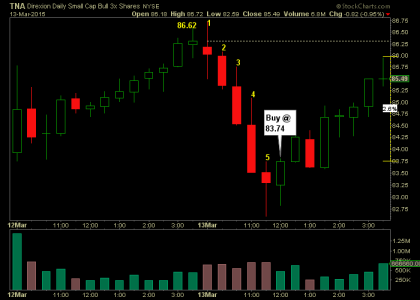
USAA is the broker. The problem was operator error, I used a limit order and since price was lower than the limit amount, it executed. What I had wanted to do was place a limit/stop where the limit does not execute until the stop price is reached.

In this case, I placed a limit order @ 86.62 which was just above the previous day's high. When I placed the limit, price was already at 86.48 which was better than the limit price I set, so the order executed. Because of that, I was forced to either let myself get stopped out, out take a lower entry to offset the loss. Since I was confident the markets were going to reverse, I took another entry near the lows at 83.

What I had originally wanted to do was place a limit/stop, where you trail it down to the high of each candlestick until the order triggers. Doing this, the order would have triggered on the 6th candlestick @ 83.74, from there I could have put on a tailing stop.

sc.png

JTH,Did you buy two sets of TNA and Dig at different prices? When you say that both TNA positions equalize to 84.74, is this the same as saying that you averaged 2 prices by dividing the sum by 2? Thanks in advance for your clarification.

Yes, 2 sets at 2 different prices, by equalize, I mean the sum cost divide by the sum shares.
 
USAA is the broker. The problem was operator error, I used a limit order and since price was lower than the limit amount, it executed. What I had wanted to do was place a limit/stop where the limit does not execute until the stop price is reached.

In this case, I placed a limit order @ 86.62 which was just above the previous day's high. When I placed the limit, price was already at 86.48 which was better than the limit price I set, so the order executed. Because of that, I was forced to either let myself get stopped out, out take a lower entry to offset the loss. Since I was confident the markets were going to reverse, I took another entry near the lows at 83.

What I had originally wanted to do was place a limit/stop, where you trail it down to the high of each candlestick until the order triggers. Doing this, the order would have triggered on the 6th candlestick @ 83.74, from there I could have put on a tailing stop.

View attachment 32919


Yes, 2 sets at 2 different prices, by equalize, I mean the sum cost divide by the sum shares.

JTH, thank you again. That was a beautiful plan for the trade, even when you had operator error. This is a great lesson for me. Btw, is this a 30 minute chart by which you guide and set your trades?
 
JTH, thank you again. That was a beautiful plan for the trade, even when you had operator error. This is a great lesson for me. Btw, is this a 30 minute chart by which you guide and set your trades?

Thanks Airlift, since I was home, I was using very large 15-minute charts. When posting to the forum I use 30-min charts because of the picture size restrictions and because I don't want to charts to be too cluttered.
 
Thanks Airlift, since I was home, I was using very large 15-minute charts. When posting to the forum I use 30-min charts because of the picture size restrictions and because I don't want to charts to be too cluttered.

JTH,

I opened and saved the 2-day, 15 minute chart, because I can see with more clarity the Bollinger Bands as they contract, as well as some other indicators. Whenever you can, please explain how you determine the entry and exit points in a 15 minute chart. For example, do you look at the previous day price performance, in addition to volume, as well as the geopolitical tensions that might derail or help the trade? I do remember you telling me that it is difficult these days to establish the day's trade range? Btw, on 3/10, I had bought TNA, at 80.2699 (filled at 12:26:10). This is doing well. On 3/12, I added more TNA, at 84.72 (filled at 12:11:49). However, yesterday, Friday, looking at the big drop, I got got cold feet, for two reasons. The coming week, with a rumor that Russia or some other geopolitical issue might take center stage; and also, the uncertainty and expectation from the Fed announcement coming on the second day of the meeting. I was down to the lowest point of the day, and saw a comeback. I waited and sold some TNA at 84.7302 (filled at 1:56:53). As you can see, I still have some dry powder. Now, I can take some hits to the downside, and at the same time I can wait until a good drop occurs in order to take advantage of deploying the additional funds. Now, I have to determine a potential entry point, which may or may not be when the Fed announces whether to take the word "patience" out of the equation.

Of course, I will appreciate any additional observation from you. And, I thank you in advance for any opinion you may find helpful.
 
JTH, Whenever you can, please explain how you determine the entry and exit points in a 15 minute chart. For example, do you look at the previous day price performance, in addition to volume, as well as the geopolitical tensions that might derail or help the trade?

I am still evolving my style, I'm limited in what I can do because of work, money and the trading platform. I do watch the futures to see how they correlate to the day's price action. Do positive futures = a positive day? If so then it's a good sign the markets are trending. When looking for entries, I don't look for places I want to buy/sell, I look for places where I think other people want to buy and sell. I mostly use log-scale trendlines, volume, and judge the waves of price action using the 50% rule. I don't use technical indicators very often, because I'd rather rely on my own judgement.
 
I am still evolving my style, I'm limited in what I can do because of work, money and the trading platform. I do watch the futures to see how they correlate to the day's price action. Do positive futures = a positive day? If so then it's a good sign the markets are trending. When looking for entries, I don't look for places I want to buy/sell, I look for places where I think other people want to buy and sell. I mostly use log-scale trendlines, volume, and judge the waves of price action using the 50% rule. I don't use technical indicators very often, because I'd rather rely on my own judgement.

JTH,

I have been studying various articles. I googled "log-scale trend lines" as well as "waves of price action using the 50% rule". Google came up with numerous articles on the subject, which admittedly, are complex and will take a bit of time in a learning curve in order to master its elements. The most respected opinions that I follow, opine that we are going down this next week. That perhaps the SPX will test either the lower rising trendline at the 2020 level or further down to the DMA (200) at 2003.46.

I am hopeful that you will post your considered opinion regarding SPX and TNA. I have some dry powder to deploy and don't want to throw it away. At my own risk, of course, this will help me understand your observations, but I am sure that others will appreciate the benefit of your highly regarded opinion. Thank you JTH.
 
The most respected opinions that I follow, opine that we are going down this next week.

Hi Airlift

I set-aside a very small portion of my brain to what other folks think the markets are going to do verses what the markets have already done. I don't know where these traders come from, how they were raised, what their current circumstances are, the validity of their data, their predisposition, or if they even trade at all.

Here's what I can tell you, I believe we are closer to a bottom than to a top, but I honesty don't care if I'm right, just how the position is managed.

Buyers stepping in on the last hour of trading on Friday
W4500 and the Transports closed the week up
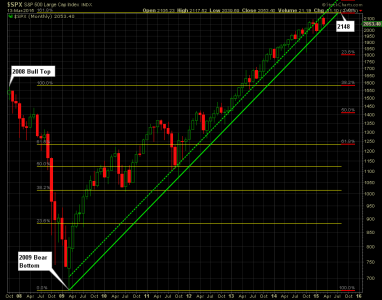
From the Feb low to Mar highs, SPX, W4500, TRAN, & NDX are all trading above 50% of that price range
 
Both TNA positions equalize to 84.74 the position is still open and is currently down -.27%

Both Dig positions equalize to 46.79 the position is still open and is currently down -1.08%

Tablet trading

Stops are in
 
Hi JTH,

where did you place your stops? Tia.

Sry not much time to communicate during the session


Both TNA positions equalize to 84.74 the position is still open and is currently down -.27%

Both Dig positions equalize to 46.79 the position is still open and is currently down -1.08%

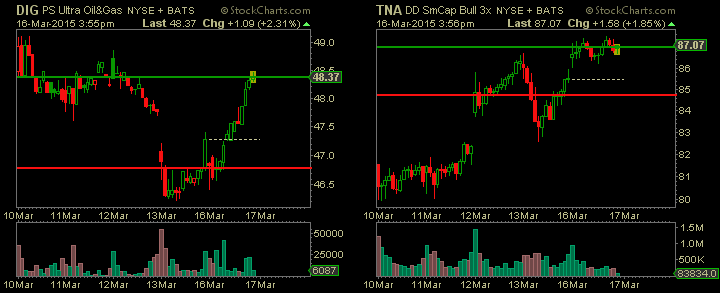
In TNA @ 84.74 Out of TNA @ 87
In DIG @ 46.79 Out of Dig at 48.36

1.png
 
Sry not much time to communicate during the session


In TNA @ 84.74 Out of TNA @ 87
In DIG @ 46.79 Out of Dig at 48.36

View attachment 32950

JTH,

That was a fine trade! I could not make out the indicators. I think that you used a 5- or 6-day chart. What other indicators are there? Are those quadrant lines, or what? Tia.
 
Back
Top