JTH's Account Talk

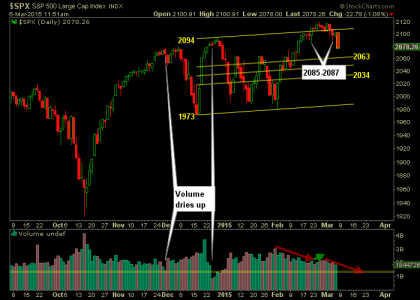
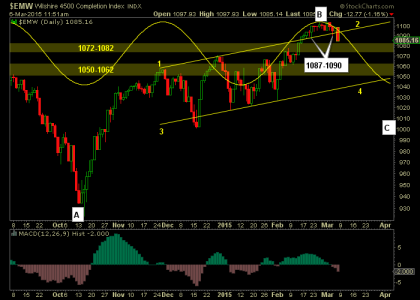
JTH, having breached 2085, and assuming SPX keeps going down, do you think that buying down in increments is a good entry strategy for the next upside?

The key levels I've been talking about in my blogs all week, are breached, now is a good time to sit on my hands, I'm not going to buy into a weakness under these specific conditions.
0001.png
002.png

Also, I was stopped out of both my positions in DIG, was late to the game on that trade, so it didn't work out.
 
___
Caught a bite of DIG at the open, it was a limit order I put in last week. In at 54.77, plan to work around this position within a longer-term timeframe.

2nd Limit triggered @ 51.73

Also, I was stopped out of both my positions in DIG, was late to the game on that trade, so it didn't work out.

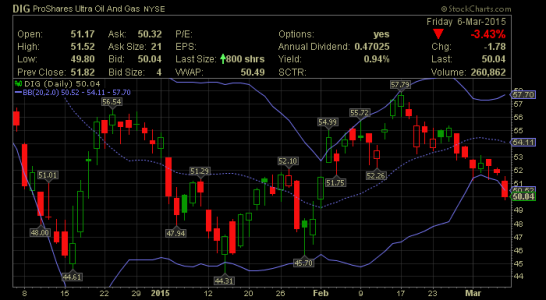
Stopped out @ 51.00 for -6.83% loss, could have held out longer, but it wasn't working, so I allowed it to get cut. All positions are in cash, from here on, I'll sit it out and look to see how the price action unfolds.

sc.png
 
PnF: RISK OFF

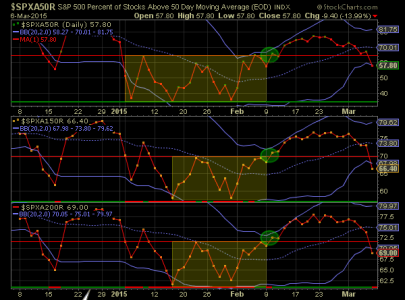
Although prices pulled back just above the previous 1988-2064 trading range, the number of S&P 500 stocks above their 50/150/200 day moving average has pulled back further, crossing back into the yellow zone. Take notice we extended below the lower bollinger bands.

2015-03-07 - 08.png
 
I think it may just be normal rotation and that is positive for the market.

That is very well most likely the case, just a casual pullback, pruning the leaves. Or it could be the beginning of the worst depression in the history of the entire world. :banana:
 
That is very well most likely the case, just a casual pullback, pruning the leaves. Or it could be the beginning of the worst depression in the history of the entire world. :banana:

I think it was a bogus excuse on why the market dropped yesterday. I think the market manipulators thought that would make more sense then "we decided to lower the market today because WE wanted to make more money than you". Just my opinion.
 
Trading the Stats: Week 10

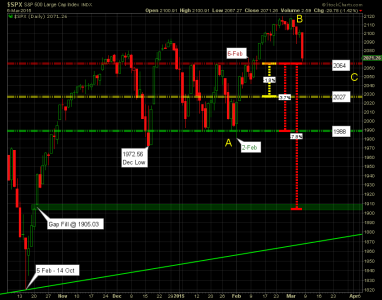
A 50% retracement of wave AB takes us to 2050 @ C

View attachment 32798

JTH,

Thanks for for the useful and informative charts. As a learning exercise, the prior chart you posted showed a price target of approx. 2038. This one traced down to 2050. Is it correct to reconcile both price targets as valid, lower support areas? Tia.
 
Algorithms are controlling the Markets, now the computers are driving the investors to the short side then the trap snaps shut and they start buying in big time and sucker them back in the market after losing their butts. There should be a Law!
 
I think it was a bogus excuse on why the market dropped yesterday. I think the market manipulators thought that would make more sense then "we decided to lower the market today because WE wanted to make more money than you". Just my opinion.

It's all really quite silly, this market spends more of it's time pricing in a rate cut, then focusing on the fact, we are the best horse in this race. I'm fortunate, I don't even attempt to make sense of things. The signs were there, the Transports closed down the last 7 of 8 days, S&P 500 the last 6 of 8. Once 20-Feb's tail was breached, the writing was on the wall, IMHO the jobs report just escalated the perspective sellers were already predisposed to.
 
JTH,

Thanks for for the useful and informative charts. As a learning exercise, the prior chart you posted showed a price target of approx. 2038. This one traced down to 2050. Is it correct to reconcile both price targets as valid, lower support areas? Tia.

I can't find anything that says 2038, I would need to see the specific chart you are referring to, before answering the question.
 
I can't find anything that says 2038, I would need to see the specific chart you are referring to, before answering the question.

I am referring to the bearish price reversal that you noted would be triggered at 2038.20.
 
JTH,

Thanks for for the useful and informative charts. As a learning exercise, the prior chart you posted showed a price target of approx. 2038. This one traced down to 2050. Is it correct to reconcile both price targets as valid, lower support areas? Tia.

I am referring to the bearish price reversal that you noted would be triggered at 2038.20.

This is all just speculation, so I'll answer as best I can, I see 2038-2050 as a guide

2038 is a PnF chart based off the .25% box-scale, while 2050 is based off the Daily scale. It's like comparing apples to oranges, you can eat them both, but they don't taste the same. The 2038 reversal is based off specific rules I have no influence over. Once 2038 is triggered, it will mean there will be a lower low, thus inducing a Double Bottom Breakdown.

You can also look at it like this

2038 is physical support because prices bounced off this level within the .25% box-scale

2050 holds no physical significance, under this chart's context, it is mental support because it's both half of wave AB and it's a solid round number
 
Back
Top