JTH's Account Talk

I am seeing so many different charts lately, from so many different people, I can't tell which one I want to believe anymore.

Off the 8 Aug bottom prices are rising in a large channel, with the recent lower highs prices have been getting pent up. The bad news has been getting priced in over the last 2 months, Greece is of little significance in the grand scheme of things, this market is poised to recover, I'm both scared and excited to be in this market.
 
This is our third close above the 20SMA, the previous time this happened we pulled back, a forth close above this SMA leads to a test of the 50SMA at the lower red trendline. A break above this SMA could spark buy orders creating momentum as more buy orders get triggered with each stock & index passing this threshold. You don't have to believe me, when I fell from the grace of the all mighty Auto Tracker, the PMs stopped flowing, suddenly I lost all my groupies. I will recover, I gots me some tiger blood...

View attachment 15358

I'm still with you JTH! lol
 
Jason

I got the SMA figured out. Meaning, I can compute it for any stock, period, etc. I can tell when the 3d goes over 10d, 10d over 20d, etc. However, not sure how to use the information. I know that it's good when the shorter sma crosses above the longer sma. What is the importance/benefit, advantage/disadvantage of using a shorter term (i.e. 3d/10d) over a longer term (i.e. 20d/50d or 50d/200d). Not sure which combination (3/10, 13/25, 10/20, 20/50, 50/200, etc) I should be using and why.
What's your opinion?
 
I'm still with you too. You will rise like the Phoenix and have groupies again. You are still the chart man. You only had one mistake and I think the whole investment community had problems lately.
 
Thanks everyone, it's good to have some humor as we work through this mess. JP the 20, 50, & 200 MAs are the most important because they are the most universally watched. It's all a big joke really, as they are just numbers but for some reason we assign these numbers some level of importance over other numbers.
 
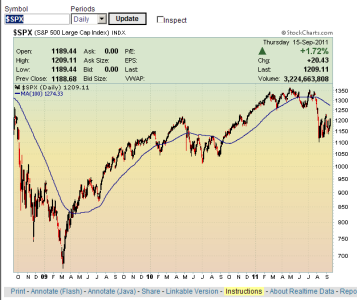
I'm seriously considering using the cross of price above and below the 100SMA for my decisions in the future. Buy when price moves above the 100SMA and sell when price moves below. Everything else is noise...

100sma.png
 
I always wanted to be the guitar player in the band; however, since, I have very little time to practice, I'm happy to be the groupie. Thanks for sharing your insights and thoughts. This has been a very intereting few months to say the least.
 
This thread is one of the first places I look when trying to understand market action. :) Thanks for sharing your TA with us, Jason, much appreciated.
 
I'm seriously considering using the cross of price above and below the 100SMA for my decisions in the future. Buy when price moves above the 100SMA and sell when price moves below. Everything else is noise...

View attachment 15361

Sounds interesting. Why don't you give it a name and put it on the AT so we can see its performance?
 
omg, what are you going to do with all these panties being thrown on stage? you're only 4% to the good on me and look at the treatment you get. looks your groupie base is still intact. f'n rock stars anyways.
 
Back
Top