jpcavin's Account Talk

Going to lunch. Put a trailing stop loss order in. Will still be in the money if it triggers but hope it doesn't.
 
Good Friday is the one NYSE holiday with a clear positive bias before and negativity the day after. DJIA, S&P 500, NASDAQ and Russell 2000 all have solid average gains on the day before, but are all net losers on the day after Easter. NASDAQ has been notably strong, up 19 of the last 21 days before Good Friday and fifteen straight since 2001.
The day after Easter has the worst post-holiday record though average losses are steeper after Presidents’ Day. The S&P 500 has been down 22 times in the last 36 years on the day after Easter. DJIA and NASDAQ have decline 21 times in the same time period. The Russell 2000 is worst, down 26 times.

tumblr_inline_o4ia2f4jxA1spdppr_500.jpg


Almanac Trader
 
Over the past 26 years the DJIA and S&P 500 have declined 17 times and advanced 9 with an average loss approaching 1.0% near the end of March. Excluding advancing years, the average decline is right around 1.6% for DJIA and S&P 500. End-of-quarter portfolio restructuring likely plays a role as managers lock in any gains and establish positions for the next quarter. These declines can begin on either the fourth-to-last trading day or the third.

Almanac Trader
 
It is done. I hope it's the right decision. :blink:

Good luck! I hope so too, the SPX chart doesn't look pretty, though this market lately has been anything but rational.

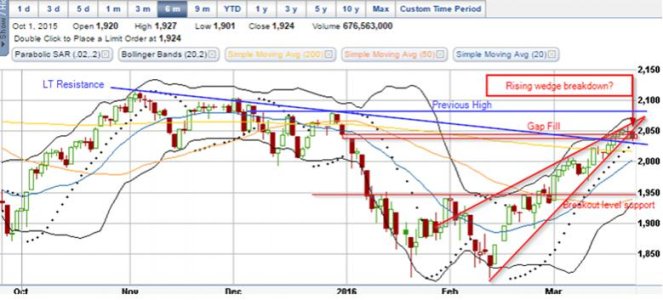
Here's what I'm currently seeing. It's up against a rising wedge and LT resistance. Of course there's always a chance this thing could keep going up, but according to what I see, the risk to the downside is greater atm. Despite the recent rally, we're still in a long-term downtrend unless that previous high can be broken and held.

SPX Chart
3-23-16.jpg
 
Over the past 26 years the DJIA and S&P 500 have declined 17 times and advanced 9 with an average loss approaching 1.0% near the end of March. Excluding advancing years, the average decline is right around 1.6% for DJIA and S&P 500. End-of-quarter portfolio restructuring likely plays a role as managers lock in any gains and establish positions for the next quarter. These declines can begin on either the fourth-to-last trading day or the third.

Which balances out that Best Week Of The Year March 1 - 6!
 
Good Friday is the one NYSE holiday with a clear positive bias before and negativity the day after. DJIA, S&P 500, NASDAQ and Russell 2000 all have solid average gains on the day before, but are all net losers on the day after Easter. NASDAQ has been notably strong, up 19 of the last 21 days before Good Friday and fifteen straight since 2001.
The day after Easter has the worst post-holiday record though average losses are steeper after Presidents’ Day. The S&P 500 has been down 22 times in the last 36 years on the day after Easter. DJIA and NASDAQ have decline 21 times in the same time period. The Russell 2000 is worst, down 26 times.

tumblr_inline_o4ia2f4jxA1spdppr_500.jpg


Almanac Trader

This particular holiday stat is not so easy to compare along side other holidays, because sometimes it's in March, while other times it's in April.
 
Almanac Trader


Our Sell Signal on April 5 applied only to DJIA and S&P 500 related positions. NASDAQ’s “Best Eight Months” last until June. We continue to hold technology and small-cap positions in both our Almanac Investor ETF and Stock Portfolios. Our Sell Signal for DJIA and S&P 500 is used to remind us to lighten up on long positions and begin looking at tightening stop losses and other defensive positions such as Treasury bonds as the historically “Best Six Months” of the year are nearing their end and the odds of further significant gains are beginning to fall.
 
I left work early last Friday (59 mins :banana:) and got in my car and started driving. As I pull out of the parking lot, I hear this funny sound and people are looking at me funny...well, not really funny, just staring at me. :worried: What? Why's everybody staring at me? Am I dragging a dead body? What? Anyway, I get out of my car and look around and lo and behold, my right rear tire is completely flat. There appeared to be a nail stuck in it and when I placed my hand over it, I could feel air blowing out. A nice gentleman walks over and asks me if I have a tire pump. I say "yeah, sure, it's right there in the trunk right next to my beach chair and suntan oil." :laugh::rolleyes: He smiles and shakes his head and says, "let me go get mine.":arms:
So he hooks one end of the pump to the tire and the other end to the cigarette lighter and lets it run for a bit...(seemed like forever). I thanked the nice gentleman for his generosity and hightailed it to the service station accross the street.

After a few minutes there (I was the only customer), the service technician walks into the waiting area to show me what was in the tire. A four-inch drill bit. Talk about getting screwed. :eek:

e4f94f6e8491e17d4876b9caa100b0b8.jpg
 
Last edited:
Will the next DJIA “Golden Cross” matter?

Should the 50-day average cross above the 200-day average it would trigger a golden cross. Generally a golden cross is considered a bullish event however that was not the case last December 17. In fact since about 2000, the majority of golden crosses have occurred near a top with numerous flat or negative DJIA “Subsequent Moves” and “Next Moves.” Out of 36 such moves since 2000, only 5 have been double-digit and greater advances. The largest such was a QE-fueled 51.32% move from June 4, 2012 until May 19, 2015 (DJIA’s All-time closing high date).
 
Back
Top