jpcavin's Account Talk

Hey Everyone, I just wanted to take a moment to thank all of you. It was so nice of you to stop by to wish me a "Happy Birthday", it made my birthday just a little bit more special. Thank you.


Hi Judy! Darn it..I'm late....but still wishing you a HAPPY BIRTHDAY!!! :friday::grouphug::fest30::party:

Hoping you had a fun-filled and beautiful day!
 
Hi JPCavin,
These charts are great! I like chart 101 the best! I had read about this over a year ago (maybe one of your posts!): how different sectors of the market follow a pecking order, falling one-by-one, as we go into bear market "within" the current overall "secular" long-term bull market.

I think we are definitely headed there. Chart 101 indicates that we are already in a short-term bear within the overall secular bull market. That is indicated by the ROG now below zero. So we are in a bear market???..look at how circled area for 2001, 2008 and now late 2015/2016 look the same! he has 2016 marked green....but it clearly has hit the ROC indicator, so think it should be marked red for current period IMHO.

As for what cycle we are in, I am not sure ...phase 5, 6.... But in either case, I think we get to the end in a quick crash sometime this year or early next year. I am going to study those financial sectors this evening to see if I can figure out where we are at.

Best wishes to you !!!!!!! :smile:


I'm trying something new for my buy/sell signals. Basically I am looking to use the MACD(8,17,9) as my buy signal and MACD(12,25,9) as my sell(maybe)....while at the same time keeping an eye on the longer term MACD(65,90,12) to try to avoid any whipsaws. I still cant quite figure out the charts and I don't really know how to back test anything so I am sort of observing and winging it as I go along. Definitely will not even consider exiting equities until I see the MACD(8,17,9) changing direction.
 
I'm trying something new for my buy/sell signals. Basically I am looking to use the MACD(8,17,9) as my buy signal and MACD(12,25,9) as my sell(maybe)....while at the same time keeping an eye on the longer term MACD(65,90,12) to try to avoid any whipsaws. I still cant quite figure out the charts and I don't really know how to back test anything so I am sort of observing and winging it as I go along. Definitely will not even consider exiting equities until I see the MACD(8,17,9) changing direction.

A rare rant, but I feel I needed to speak out on this for the benefit of others.

I feel for you, I was fortunate enough at one time to have the Nija software configured with pre-IFT conditions. With it, I was able to back-test every indicator & timeframe you could think of. Some of these scans were very processor intensive, where I'd have to walk away from the PC for 30 minutes and wait for the results. It was grueling work, I must have spent hundreds of hours and many 12-hour sessions, locked in my office looking for the holy grail, but never did I find it. Unfortunately, my PC has crashed many times since then and I was never able to reconfigure the Nija after their next upgrade, but I did learn many valuable lessons, (not that I've applied them).

Here's some of the things I learned (that I can remember)

1) As a wild unscientific estimate, I'd say 99% of indicators cannot beat the markets.
2) Momentum indicators work better when the markets are trending, but erase the gains when the markets are oscillating.
3) Equally so, oscillating indicators work better when the markets are oscillating, but erase the gains when the markets are trending.
4) If you use indicators, it's very important to know what conditions the markets are operating under (trending vs. oscillating)
5) MA crossovers don't work very well, in fact some of the best scanning results were from short-term inverted crossovers (probably triggered from oscillating market conditions).
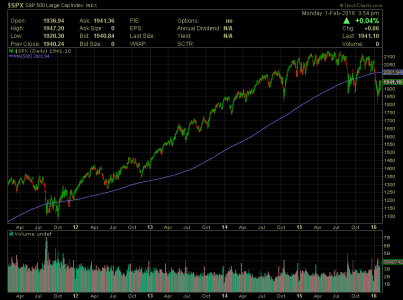
6) The best price to MA crossover I scanned (where price was below or above) was with the MA in the low 500s (I think it was either 512 or 518) this was the most profitable for long-term trading. I ended up using the 500 SMA as the best signal (because I like round numbers) If I had to pick 1 MA as a bear market indicator, it is the 500 MA.

Lastly (and most frustrating) the indicator conditions that I found worked best on the S&P 500, did not work nearly as well during different timeframes (Cherry picking) or on other Indexes or stocks, meaning some indicators are custom tailored to only work with a specific symbol during a specific time.
sc.png
 
A rare rant, but I feel I needed to speak out on this for the benefit of others.

I feel for you, I was fortunate enough at one time to have the Nija software configured with pre-IFT conditions. With it, I was able to back-test every indicator & timeframe you could think of. Some of these scans were very processor intensive, where I'd have to walk away from the PC for 30 minutes and wait for the results. It was grueling work, I must have spent hundreds of hours and many 12-hour sessions, locked in my office looking for the holy grail, but never did I find it. Unfortunately, my PC has crashed many times since then and I was never able to reconfigure the Nija after their next upgrade, but I did learn many valuable lessons, (not that I've applied them).

Here's some of the things I learned (that I can remember)

1) As a wild unscientific estimate, I'd say 99% of indicators cannot beat the markets.
2) Momentum indicators work better when the markets are trending, but erase the gains when the markets are oscillating.
3) Equally so, oscillating indicators work better when the markets are oscillating, but erase the gains when the markets are trending.
4) If you use indicators, it's very important to know what conditions the markets are operating under (trending vs. oscillating)
5) MA crossovers don't work very well, in fact some of the best scanning results were from short-term inverted crossovers (probably triggered from oscillating market conditions).
6) The best price to MA crossover I scanned (where price was below or above) was with the MA in the low 500s (I think it was either 512 or 518) this was the most profitable for long-term trading. I ended up using the 500 SMA as the best signal (because I like round numbers) If I had to pick 1 MA as a bear market indicator, it is the 500 MA.

Lastly (and most frustrating) the indicator conditions that I found worked best on the S&P 500, did not work nearly as well during different timeframes (Cherry picking) or on other Indexes or stocks, meaning some indicators are custom tailored to only work with a specific symbol during a specific time.

Thanks everyone :)

Just for some clarification, I'm not disparaging those who use indicators, nor is it meant to be an "indicators don't work" rant. My personal belief is that indicators are tools, and the most important indicator is not the tool, but the person who operates it.

Also, I want to clarify that the majority of my scans were performed under End of Day TSP conditions, meaning there was 1 day of slippage between the trigger of the indicator, and the execution of the IFT. This wasn't such a big deal on the indicators setup for long-term conditions, but the results of the short-term indicators were mostly horrible (sort of like zigging when you should be zagging). The only exception I found was with the inverted setups, as an example, buying when the 9MA crossed under the 18 MA (probably while the markets were not trending, but oscillating).
 
Last edited:
Back
Top