For awhile it looked like today's action would give back most of yesterday's gains, but in the last half hour of trade stocks rallied back to erase a large portion of their intra-day losses.
The unemployment picture was a positive as anticipated, but oil once again tempered any enthusiasm for stocks. The February nonfarm payrolls was up 192,000, while private payrolls increased by 222,000. Both were better than anticipated and even the prior months data was adjusted upward. The unemployment rate fell to a 22-month low of 8.9%.
But as I said, oil tempered those employment numbers as it once again hit a fresh two-year high at $104.60 per barrel at its peak before settling at $104.42 per barrel at the close.
There did not appear to be any reason for the end of day rally, but I suspect the herd is simply conditioned now to buy the dips. And so they did. Monday's are always green, right?
Here's today's charts:

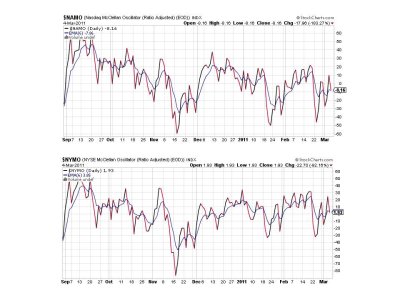
NAMO and NYMO both fell back near their respective 6 day EMAs.

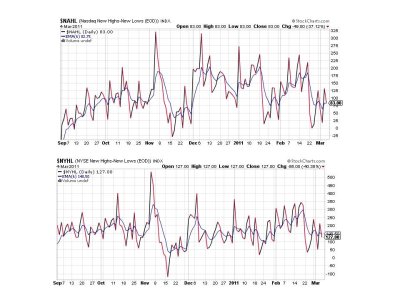
NAHL and NYHL also fell back and are also near their 6 day EMAs.

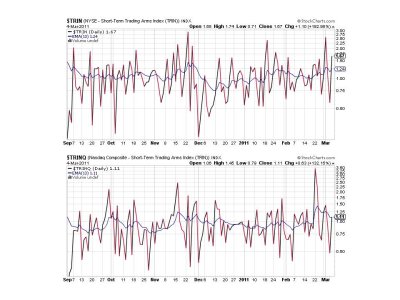
TRIN and TRINQ both flipped to a sell, with TRINQ sitting almost right at its trigger point.

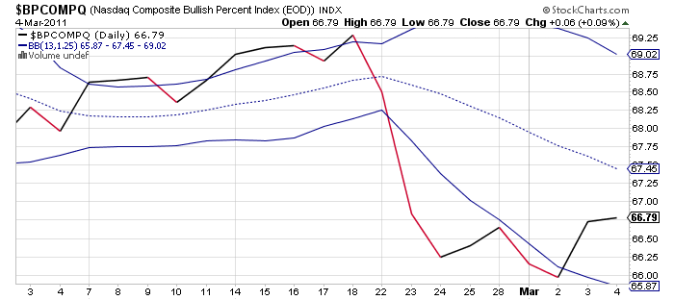
BPCOMPQ managed to ebb just a bit higher and remains on a buy.
So the Sentinels appear to have gone back to a neutral condition overall, but the system remains on a buy. I can't read too much into these charts given the volatile action as things can change very quickly in such an uncertain market. We didn't rally on the 1st of March, so I'm guessing that Monday won't be the free money day that so many traders have come to expect.
I'll be posting the tracker charts over the weekend, so I'll see you then.
The unemployment picture was a positive as anticipated, but oil once again tempered any enthusiasm for stocks. The February nonfarm payrolls was up 192,000, while private payrolls increased by 222,000. Both were better than anticipated and even the prior months data was adjusted upward. The unemployment rate fell to a 22-month low of 8.9%.
But as I said, oil tempered those employment numbers as it once again hit a fresh two-year high at $104.60 per barrel at its peak before settling at $104.42 per barrel at the close.
There did not appear to be any reason for the end of day rally, but I suspect the herd is simply conditioned now to buy the dips. And so they did. Monday's are always green, right?
Here's today's charts:

NAMO and NYMO both fell back near their respective 6 day EMAs.

NAHL and NYHL also fell back and are also near their 6 day EMAs.

TRIN and TRINQ both flipped to a sell, with TRINQ sitting almost right at its trigger point.

BPCOMPQ managed to ebb just a bit higher and remains on a buy.
So the Sentinels appear to have gone back to a neutral condition overall, but the system remains on a buy. I can't read too much into these charts given the volatile action as things can change very quickly in such an uncertain market. We didn't rally on the 1st of March, so I'm guessing that Monday won't be the free money day that so many traders have come to expect.
I'll be posting the tracker charts over the weekend, so I'll see you then.
