It's Confirmed

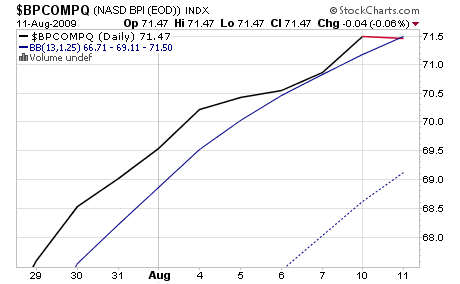
We have a sell on Seven Sentinels. All seven are in sell mode simultaneously. The only chart that I had to zoom in on, as expected, was $BPCOMPQ.

Here's the chart:
$BPCOMPQ.png

Just barely, but it's a sell.

I can simply exit the market tomorrow and not worry about a bounce or I can hold and hope.

Tomorrow's especially difficult due to the afternoon announcement by the FOMC, which could move the market, but occurs well after our cut-off for an IFT.

I could also go partially to G and simply cut risk and hope for a bounce.

But that's not playing by the indicators. And for me I'm suppose to exit when I receive a SS sell signal. This is probably what I'll do tomorrow and let the chips fall where they may.

Good luck to all. :)
 
CH,

Interpreting these signals is disconcerting at times. It is interesting that in his explanation IYB stated that he does not see this as a Seven Sentinels Sell Signal, any more than were March 30 or April 20 during the initial advance earlier this year.

The comments posted below his opinion, ask what he does to filter out the "noise" or non-actionable signals; another post asks what's keeping Don from being bearish here. Moreover, someone else said that this movement of the SS to the sell side of the equation is likely associated with relieving the short term overbought situation rather than the start of an extended downtrendtend.

You have considered splitting the risk 50/50. Is there a way to know if tomorrows trading would support IYB's opinion. If there should be some other signal before 12 noon, please let us know. If IYB is wrong, this would mean that the longer term correction has begun. Am I right?
 
airlift;bt405 said:
CH,

Interpreting these signals is disconcerting at times. It is interesting that in his explanation IYB stated that he does not see this as a Seven Sentinels Sell Signal, any more than were March 30 or April 20 during the initial advance earlier this year.

The comments posted below his opinion, ask what he does to filter out the "noise" or non-actionable signals; another post asks what's keeping Don from being bearish here. Moreover, someone else said that this movement of the SS to the sell side of the equation is likely associated with relieving the short term overbought situation rather than the start of an extended downtrend.

You have considered splitting the risk 50/50. Is there a way to know if tomorrows trading would support IYB's opinion. If there should be some other signal before 12 noon, please let us know. If IYB is wrong, this would mean that the longer term correction has begun. Am I right?

Everything you read is interpretation. Good theories can support a continued rally and they can support a bout of selling.

I've got friend on IHub who's in TSP and he usually makes some great calls. He sold out today. He follows the DOW to make TSP allocations, but it doesn't seem to be a problem in his call making.

He says he added the MACD with the quicker settings 8,17,9 and that it has already crossed back down ,indicating the MACD with normal settings should do the same.

CMF also weakening, and more important the ADX appears to have topped off.

This is good TA. But it's common TA and that has been a difficult road to travel the past few months. Still, it's a respectable position.

I have no way to quickly assess this situation tomorrow morning. It will take days to play out actually. Maybe longer.
 
Yea this is a tough one. I hate selling on weakness but that is what I thought last fall also as I watched money go to the wind. Hopefully there is a bounce tomorrow as I will probably follow the sentinels and take my spot on the lily pad.
 
Back
Top