It is no secret that this January's performance is the worst ever for this particular month. But last week the market managed to stage somewhat of a rally. The big question of course, is whether the worst is over or not?
That depends on the time frame.
In the short term, it may be. But longer term...

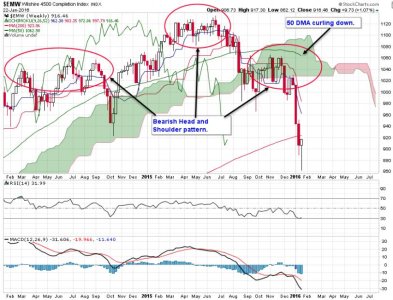
The Wilshire 4500 is made up all the U.S. stocks except those in the S&P 500. This weekly chart, which I posted here a few weeks ago, gives us a 2.5 year snapshot of its performance. Since the last time I posted it, price has fallen below the 200 day moving average. It bounced last week, but price has not reclaimed that average. And even if it does, it is no guarantee that it will hold.
I watch many charts and indicators and I am seeing signs that a short term bottom is likely in. But only "short term". I would not trust this market beyond a few days right now.
We are now entering the last week of the month. The S&P 500 is still down more than 6.5% for the month and year. The Wilshire 4500 is down almost 10% and the EFA (I fund) is down almost 8%.
The saying, "as January goes, so goes the year" has an accuracy rate of 87.7%. If those major averages do not plus up into the green next week, sentiment is going to take a big hit. And those losses are not trivial at this point. I would be very surprised if we rally enough to erase them next week.
Of course, it could go the other way too.
The FOMC meets this week (Wednesday-Thursday) with the next policy statement coming Thursday afternoon. The market has not always cheered Central Bank announcements the past couple of months or so. If they hike rates again, how will the market react this time?
Maybe it doesn't matter at this point. That chart above says that this market began retreating from its highs months ago. We may see a short term rally right now. But after that we could head right back down again. That is not a prediction, but the odds do not look good for the longer term.
That depends on the time frame.
In the short term, it may be. But longer term...

The Wilshire 4500 is made up all the U.S. stocks except those in the S&P 500. This weekly chart, which I posted here a few weeks ago, gives us a 2.5 year snapshot of its performance. Since the last time I posted it, price has fallen below the 200 day moving average. It bounced last week, but price has not reclaimed that average. And even if it does, it is no guarantee that it will hold.
I watch many charts and indicators and I am seeing signs that a short term bottom is likely in. But only "short term". I would not trust this market beyond a few days right now.
We are now entering the last week of the month. The S&P 500 is still down more than 6.5% for the month and year. The Wilshire 4500 is down almost 10% and the EFA (I fund) is down almost 8%.
The saying, "as January goes, so goes the year" has an accuracy rate of 87.7%. If those major averages do not plus up into the green next week, sentiment is going to take a big hit. And those losses are not trivial at this point. I would be very surprised if we rally enough to erase them next week.
Of course, it could go the other way too.
The FOMC meets this week (Wednesday-Thursday) with the next policy statement coming Thursday afternoon. The market has not always cheered Central Bank announcements the past couple of months or so. If they hike rates again, how will the market react this time?
Maybe it doesn't matter at this point. That chart above says that this market began retreating from its highs months ago. We may see a short term rally right now. But after that we could head right back down again. That is not a prediction, but the odds do not look good for the longer term.
