After last week's bullish ramp up in the Tracker charts, I was anticipating some profit taking last week would drop those bullish levels a bit. And they did. Let's take a look.


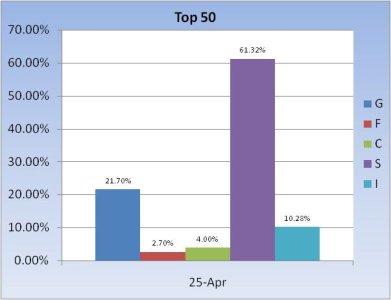
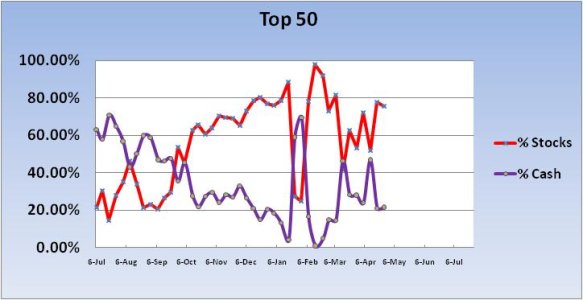
Last week total G fund holdings for the Top 50 were sitting at 21.12%. For this week, total G fund holdings bumped up to 21.7%, which was less than a 1% increase. The S fund allocation fell 4.38%, but the I fund is up 2.28% going into this week, so there wasn't much profit taking overall for this group.


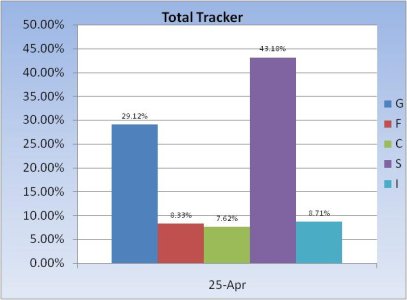
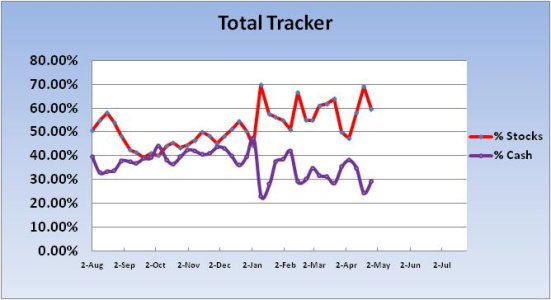
The Total Tracker saw stock allocations drop as well, but by a more meaningful amount as total stock allocations fell 9.55%, while G fund holdings rose by almost 5%. The rest found its way into the F fund.
So given the Top 50 is holding steady I'd expect the market to hold up for this last week of April. And our sentiment survey is on a hold, which keeps it in the S fund, but bullish levels rose from the previous week to 54%, so I'm not sure how much upside we can expect as result. Yes, it's a bull market and higher bullish levels don't necessarily translate to lower prices, but look for weakness early to mid-week to shake any newly minted bulls.


Last week total G fund holdings for the Top 50 were sitting at 21.12%. For this week, total G fund holdings bumped up to 21.7%, which was less than a 1% increase. The S fund allocation fell 4.38%, but the I fund is up 2.28% going into this week, so there wasn't much profit taking overall for this group.


The Total Tracker saw stock allocations drop as well, but by a more meaningful amount as total stock allocations fell 9.55%, while G fund holdings rose by almost 5%. The rest found its way into the F fund.
So given the Top 50 is holding steady I'd expect the market to hold up for this last week of April. And our sentiment survey is on a hold, which keeps it in the S fund, but bullish levels rose from the previous week to 54%, so I'm not sure how much upside we can expect as result. Yes, it's a bull market and higher bullish levels don't necessarily translate to lower prices, but look for weakness early to mid-week to shake any newly minted bulls.
