Something new to me. Seemed rather interesting & thought I'd share this analysis:
Friday’s Trading - 4/24/09
SPY Rounding Top
The market has defied my rising-wedge, and my head-and-shoulders, but now it has to deal with “
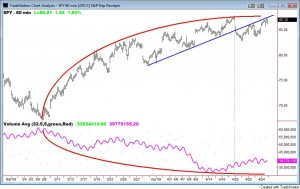
The Gigi Rounding Top.” Here is a 60-minute SPY chart of the rally so far (click to enlarge):

First, look at the blue line. That was the lower edge of the rising-wedge pattern. It provided support three times, and now resistance two times. So, this is an important line to have on your chart.
The red line in the upper panel outlines the rounding pattern. The arc is almost perfect. Such a pattern is created by a slow, steady shift in supply and demand. Demand has declined, and supply has increased.
The purple line in the lower panel is a 32.5 hour moving average of volume, which gives a weekly moving average on the hourly chart since there are 32.5 hours in the trading week. I did that to smooth out the volume bumps better.
In a rounding top, or bottom, volume should generally be the mirror image of price, forming an opposite arc. For a rounding top, volume should decline on the way up, flatten-out at the top, and then increase on the way down. SPY’s volume arc is not so perfect, but it doesn’t have to be. From page 93 of
the textbook:
“The volume pattern on Rounding Tops is seldom as clearly defined as at Bottoms. Indeed, it is apt to be rather high and irregular throughout the entire rounding-over movement in prices. …the volume warnings do not become conspicuous in most cases until the downtrend has begun to accelerate toward the vertical.”
The green, dotted, vertical line is drawn through the rally peak so far, and we do have a pick-up in volume since the peak. Also, if you look at the daily chart, you will see that the highest-volume day of the week was on Wednesday, a down day, and then volume tailed off as the market rallied on Thursday and Friday.
Rounding turns can be explosive. From page 88 of
the textbook:
“Volume accelerates with the trend until often it reaches a sort of climactic peak in a few days of almost “vertical” price movement on the chart.”
On Friday, the market held its breath until the 2pm “stress test” announcement, and then went berserk - just like it does for an FOMC announcement. So, the market considered the announcement to be a major event. It liked what it heard, rallied up, but then failed to make a new high. The XLF and BKX also failed to make a new highs. Those failures are probably significant events.
So, this rounding-top pattern looks like it has a good chance to survive.
http://www.trivisonno.com/spy-rounding-top
