It's great having support from you folks on the message board as I try to discern where I think this market is headed this coming week, and the input I've received has helped a lot. I'm glad my fellow traders realize how difficult it is to determine risk in this environment and I know many of you are looking for some direction to make your own decisions.
Yesterday I pointed out my concerns in two areas. The first was Goldman Sachs. I have to agree with Poolman that the selling in GS the last two trading days may not be of major concern at the moment.
From Poolman:
"I see support at 159.32 and resistance at 170.46. I think it is just trading within it's trading range. Also 1 thing I was thinking could be that it's just a scare tactic. Everyone knows GS is a cornerstone stock if your into the markets. Why not trade down on a huge up day. Could be a headfake and rally time is coming again. I'm not to worried yet. And yet means immediately. Things can change fast. My immediate thoughts is "The trend is your friend" but that can change in a minute. So for now Up Up and away."
So has anything really changed?
It's very true that the selling in GS on a big Friday rally may be a scare tactic leading to a head fake. We've certainly seen those the past few months. Liquidity is still abundant. And fundamentals are not trusted by the masses making optimism fleeting and pessimism constant with continuous spikes higher. And those pessimistic spikes are really helping to fuel this rally in the form of short covering.
The second and more important concern that I had was the Seven Sentinels. You've heard me talk over and over again about how it's been whipsawed to some extend these past few months and that this was unusual for a typically solid Intermediate Term indicator. Let's look at a chart of the past SS signals:
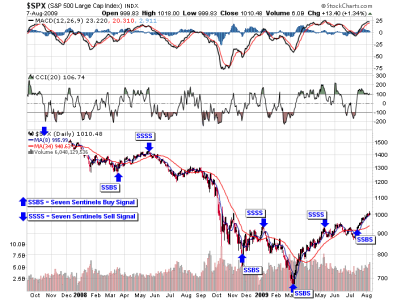
The last "official" sell signal was on May 12th. That was the first sell signal following a previous buy in early March. We had three more sell signals up until that last buy signal on July 15th. So what did the market do from May 12th up to July 15th? On May 12th the S&P closed at 908.35 triggering a SS sell signal. On July 15th the market opened at 900.77 and closed at 932.68 triggering a buy signal. In between those dates we had a low of 869.32 and a high of 956.23. That was our trading range.
In all that time the sell signal at best was good for about 30 SPX points if you were lucky enough to buy at the low. That's how strong this market has been.
Since the last buy was triggered we've gone up about 80 SPX points. So what does the SS look like now?
Here's four of the charts:
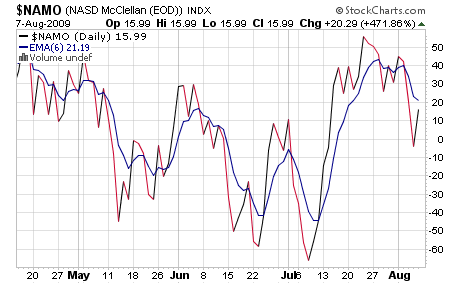
A daily reading above 6 Day EMA is buy mode, and a reading below same is sell mode. So this one's a sell.
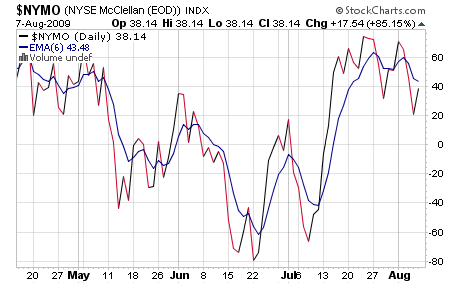
Same thing here.
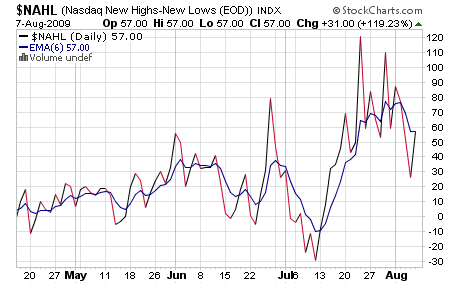
This one is borderline.
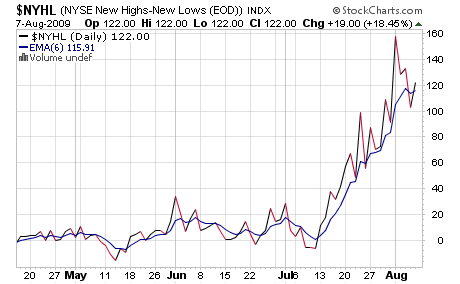
Buy mode here, but not by much.
The other three charts are as follows:
BPCOMPQ - Borderline sell
$TRIN - Borderline buy
$TRINQ - Sell
These signals are not far from a complete sell, but we are technically still in buy mode.
I agree with Poolman in that the trend is still up and head-fakes have been the rule. Pessimism is starting to rise again as many traders want to short strength as we are overextended. The daily sentiment poll for Monday on Trader's Talk looks decidedly bearish right now and many are flat with neutral sentiment. We may see some selling yet, but the dips have been getting bought and so far the bears have done very little since March. For now, it looks like I'm holding my position, although I'm wanting to shift some I fund over to S. But the bottom line for now is, I remain long.
Yesterday I pointed out my concerns in two areas. The first was Goldman Sachs. I have to agree with Poolman that the selling in GS the last two trading days may not be of major concern at the moment.
From Poolman:
"I see support at 159.32 and resistance at 170.46. I think it is just trading within it's trading range. Also 1 thing I was thinking could be that it's just a scare tactic. Everyone knows GS is a cornerstone stock if your into the markets. Why not trade down on a huge up day. Could be a headfake and rally time is coming again. I'm not to worried yet. And yet means immediately. Things can change fast. My immediate thoughts is "The trend is your friend" but that can change in a minute. So for now Up Up and away."
So has anything really changed?
It's very true that the selling in GS on a big Friday rally may be a scare tactic leading to a head fake. We've certainly seen those the past few months. Liquidity is still abundant. And fundamentals are not trusted by the masses making optimism fleeting and pessimism constant with continuous spikes higher. And those pessimistic spikes are really helping to fuel this rally in the form of short covering.
The second and more important concern that I had was the Seven Sentinels. You've heard me talk over and over again about how it's been whipsawed to some extend these past few months and that this was unusual for a typically solid Intermediate Term indicator. Let's look at a chart of the past SS signals:

The last "official" sell signal was on May 12th. That was the first sell signal following a previous buy in early March. We had three more sell signals up until that last buy signal on July 15th. So what did the market do from May 12th up to July 15th? On May 12th the S&P closed at 908.35 triggering a SS sell signal. On July 15th the market opened at 900.77 and closed at 932.68 triggering a buy signal. In between those dates we had a low of 869.32 and a high of 956.23. That was our trading range.
In all that time the sell signal at best was good for about 30 SPX points if you were lucky enough to buy at the low. That's how strong this market has been.
Since the last buy was triggered we've gone up about 80 SPX points. So what does the SS look like now?
Here's four of the charts:

A daily reading above 6 Day EMA is buy mode, and a reading below same is sell mode. So this one's a sell.

Same thing here.

This one is borderline.

Buy mode here, but not by much.
The other three charts are as follows:
BPCOMPQ - Borderline sell
$TRIN - Borderline buy
$TRINQ - Sell
These signals are not far from a complete sell, but we are technically still in buy mode.
I agree with Poolman in that the trend is still up and head-fakes have been the rule. Pessimism is starting to rise again as many traders want to short strength as we are overextended. The daily sentiment poll for Monday on Trader's Talk looks decidedly bearish right now and many are flat with neutral sentiment. We may see some selling yet, but the dips have been getting bought and so far the bears have done very little since March. For now, it looks like I'm holding my position, although I'm wanting to shift some I fund over to S. But the bottom line for now is, I remain long.
