There's no shortage of media headlines that are pointing out possible trouble ahead for the market. And many technical indicators certainly suggest the same. But is this another one of those walks up to the precipice simply to shake weak hands? Let's take a look at how we're allocated for the new week and whether we're buying into the fear.
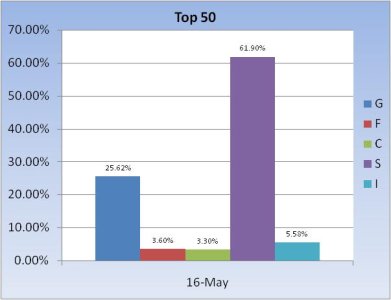
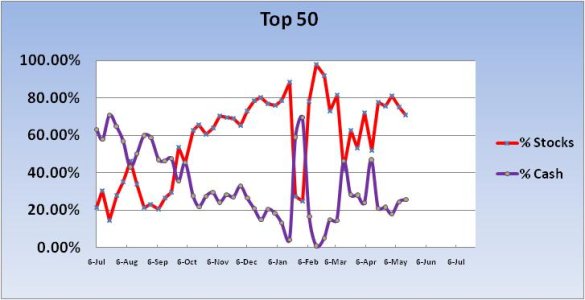
The Top 50 dropped their total stock allocation for the second straight week, but only by 4.5%. Overall stock allocation is still almost 71%, which still qualifies as quite bullish in my book.
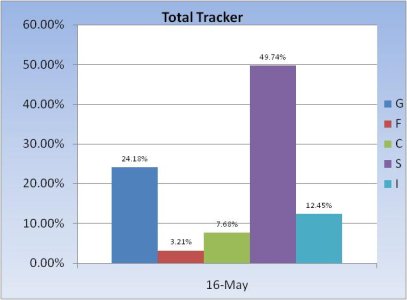
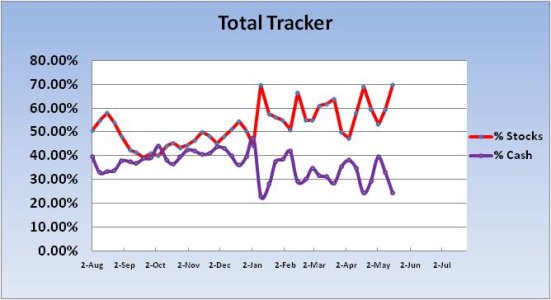
The Total Tracker (the herd) on the other hand, is buying with both hands. Total stock allocation jumped 10.5% to a total allocation of 69.87%. We're buying the dip big time. Notice that this is the third time this year we've been this bullish. Is this a good thing?
To answer that question let's take a look at some statistical information that I've compiled.
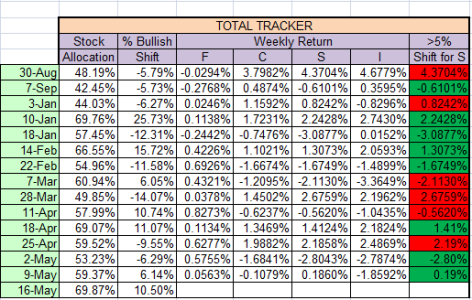
I've posted this chart once before. This chart shows those weeks where we as a group have shifted our allocations either up or down by greater than 5%. This has happened 14 times since the week of 6 July 2010. This week marks the 15th time. But of those 14 weeks, we were right 8 out of 14 times.
If I only count those times where our shift was more than 10% (there were 7 weeks), then we were correct 5 of 7 times. Not bad. Notice too, the two dates where our total allocation was near 70% (Jan 10 and Apr 18). Both those dates saw an allocation shift of more than 10% and each time we were correct.
This week our total allocation is again near 70% and our allocation increased more than 10%. Based on past performance I'd say there's a decent chance for some gains this week.
Nothing is foolproof about this data. But it's certainly nice-to-know information. Especially if one is in stocks. Good luck to all.


The Top 50 dropped their total stock allocation for the second straight week, but only by 4.5%. Overall stock allocation is still almost 71%, which still qualifies as quite bullish in my book.


The Total Tracker (the herd) on the other hand, is buying with both hands. Total stock allocation jumped 10.5% to a total allocation of 69.87%. We're buying the dip big time. Notice that this is the third time this year we've been this bullish. Is this a good thing?
To answer that question let's take a look at some statistical information that I've compiled.

I've posted this chart once before. This chart shows those weeks where we as a group have shifted our allocations either up or down by greater than 5%. This has happened 14 times since the week of 6 July 2010. This week marks the 15th time. But of those 14 weeks, we were right 8 out of 14 times.
If I only count those times where our shift was more than 10% (there were 7 weeks), then we were correct 5 of 7 times. Not bad. Notice too, the two dates where our total allocation was near 70% (Jan 10 and Apr 18). Both those dates saw an allocation shift of more than 10% and each time we were correct.
This week our total allocation is again near 70% and our allocation increased more than 10%. Based on past performance I'd say there's a decent chance for some gains this week.
Nothing is foolproof about this data. But it's certainly nice-to-know information. Especially if one is in stocks. Good luck to all.
