Ebb's Account Talk

Re: Brain Exercise

What 6-letter word do these pictures have in common?


23__a.jpg
23__b.jpg

23__c.jpg
23__d.jpg
 
Re: Double Pattern

A lot can be gleaned from the double-patterns chart below.

First: On average, the win percentage for the bullish red patterns tends to be weak on the 1st day (55%) of the DP, then gets stronger the 2nd day (65%).

Second: On average, the win percentage for the bearish green patterns tends to be strong the 1st day (58%), then gets weaker the 2nd day (53%).

A bullish red double pattern 6-6 showed up on the ebbchart for today and tomorrow. I was supposed to wait until tomorrow (2nd day of DP) to jump back into the S-fund, but the last DP taught me a valuable lesson. It was bearish green double pattern 1-1 (Dec. 13 & 16) with a win percentage of 68% the 1st day and 58% the 2nd day. The win percentage for the 1st day says it should be up (it was up), and the 2nd day (it was up also) should have a negative bias. It turned out that I was the one with a bias because I completely ignored the 2nd day's high win-percentage of 58%. That brings me to why I entered on the 1st day of double pattern 6-6 with both days showing a high win-percentage of 59%. Reward: S-fund is up over one percent today.

I'm learning how to listen to what the ebbchart numbers are saying, instead of what I think it should do. :)

12_17_13d.gif
 
Re: Double Pattern

I'm learning how to listen to what the ebbchart numbers are saying, instead of what I think it should do. :)


What?! You're just listening now? What were you listening too back in the I fund hoopla trading days?

I seem to recall that was very profitable advice your charts were talking. Don't wuss out now. Just go
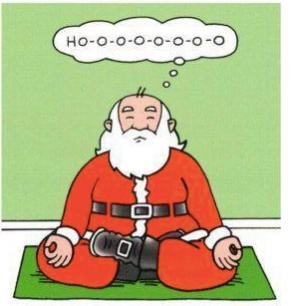
with your first instincts.

Namaste - Merry Christmas - Happy New Year

1507660_10152142650188377_1987120741_n.jpg
 
Re: Double Pattern

I'm learning how to listen to what the ebbchart numbers are saying, instead of what I think it should do. :)


What?! You're just listening now? What were you listening too back in the I fund hoopla trading days?

I seem to recall that was very profitable advice your charts were talking. Don't wuss out now. Just go
with your first instincts.

Namaste - Merry Christmas - Happy New Year

View attachment 26326

And a Merry Christmas and a Happy New Year to you.

Those were the days, and years later the ebbchart patterns (1-8) have captured a snapshot of the daily market a remarkable 200 times each (on average). The win percentages for each pattern in the C, S, and I-fund (2007-2013) are shown below. Do keep in mind that the S&P 500 had a win percentage of 54.8% over the same 7-year period.

The chart below is the up-to-date 7 yr. ebbtally (compiled since 2007). Notice how patterns with two or more red signals (bearish sentiment) -- 5/RRR (59.0%), 3/GRR (56.0%), 8/RGR (54.3%), 6/RRG (52.9%) -- on average, have a higher win-loss percentage than patterns with two or more green signals (bullish sentiment) -- 7/RGG (51.9%), 1/GGG (52.9%), 2/GGR (53.5%), 4/GRG (54.6%). That's the contrarian trading strategy at work -- markets tend to go up when sentiment is bearish and down when sentiment is bullish.

12_18_13b.gif
 
Back
Top