DreamboatAnnie's Account Talk

So just looking at C and S fund charts. Prices are very close to the support zones for those charts and now at about the 20-day SMA l(Bollinger Band mid-point on charts I am using). It is very close so will see how Monday goes. Chart links at posts #2217-2218 (page 185)

The Friday close for S fund was 1470.70 and the support zone is from 1462 t0v1466 (shown as chart highs for June, July and Aug).

C fund closed at 2871.68, while there is support zone at 2872.87 (Jan high) and 2863.43 (first wk in Aug)..

So price is knocking on support and I am now just watching to see it holds for an entry.

Futures are up right now, so hmmm... maybe an entry on Tuesday.

Best Wishes to you all!!!!!!! :smile:
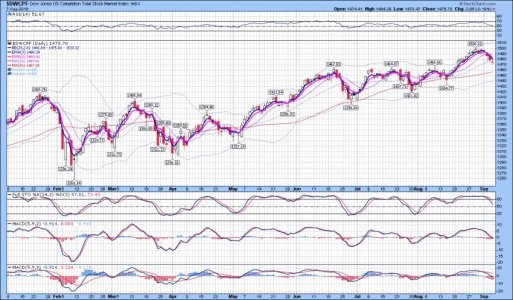
S Fund - 4-Month Daily Chart 9-7-18.jpg
 
Last edited:
Okay. I see what looks like a MACD cross over (positive) on the C Fund and I fund chart and so close on S fund. I am going to enter today.
C=30, S=50, I=20 … the I fund is a bit scary at this time because mid-point on Bollinger still sloped down, but it has room to go if it turns fully.

Best Wishes to Everyone !!!!!! :smile:
 
Well with the COB prices, there was no upward Stochastic or MACD crossover....:( So hoping market moves up.... But during the day, when I made decision to enter it was right there. It was up but dropped in the afternoon....Eeeeeeekkkkkk…….:scared1:

Okie... so reminder to self...Consider not entering based on midday pricing and charts!!

Hope your having a Great Evening!! :laugh:


P.S.Right now Dow futures up 56 points.
 
Last edited:
Hello! I was thinking about re-allocating between C, S and I today but I missed the deadline. So I may do that tomorrow. Still looks like it has room to move up further. Thinking to put more into I and C funds and less into S fund but will need to look at charts tonight.

Hope your having a Great Day!! Best Wishes to you all!!!!!! :smile:
 
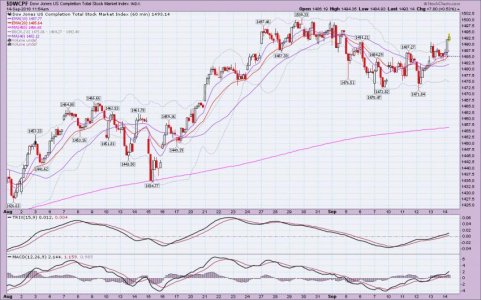
Howdy, I put together NEW ADDITIONAL charts using 1-hour candles. Here are the new 1- hour candle charts using a 45 day window.

1-HOUR CHARTS -- (showing 45 days)

S FUND (DWCPF)
$DWCPF | SharpChart | StockCharts.com

C FUND (SPX)
$SPX | SharpChart | StockCharts.com

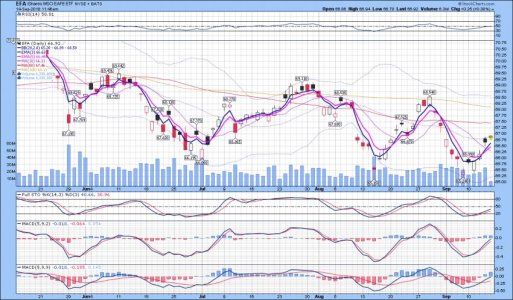
I FUND (EFA)-Alternate but I like best
EFA | SharpChart | StockCharts.com

I FUND (IEE)
$IEE | SharpChart | StockCharts.com

F FUND (AGG)
AGG | SharpChart | StockCharts.com

I like the more granular information the 1-hour charts provide.

I am still looking at weekly charts AND paying plenty of attention to the daily charts. But I am also liking these new 1-hour charts. I played around with various momentum indicators and EMA timeframes. I find these to be useful (45 day 1-hour charts). I just need to keep REMINDING myself that these are 1-hour charts. I think MACD default seems to work very well in looking at important cross overs PLUS I added TRIX as it gives smoother cross overs...nearly the same as default MACD. No Stochastics as they are just TOO busy no matter which setting --or so it seemed to me. Also RSI did not seem to add a lot. I did notice that divergences are more notable on these 1-hour charts. Ex. S fund - look at TRIX from 8./23 to 8/30..it moves lower overall while market pricing was going up overall...then followed by weakness thereafter. Its easily visible in MACD as well.

FYI - I will stlll be using the 4 month DAILY candle charts that I posted links to last week (page 185, post #2217 & #2218) AS THOSE ARE MY FAVORITES and will not make any changes to them. But, I am planning to Delete older (Stockchart) links for 6,9 or 12 month daily charts with thought to eventually renew them using the MACD settings that I am now using.

Best Wishes to All!!!!! :smile:
 
Last edited:
DBA for some reason your links don't work for me. Anyone else have that problem?:sick:
 
Links don't open in Firefox but it could be work security. If I get a chance I'll try at home.
 
This is what I get:
Unable to connect

Firefox can’t establish a connection to the server at schrts.co.

The site could be temporarily unavailable or too busy. Try again in a few moments.
If you are unable to load any pages, check your computer’s network connection.
If your computer or network is protected by a firewall or proxy, make sure that Firefox is permitted to access the Web.

An example of one of the links.

https://www.tsptalk.com/mb/redirect-to/?redirect=http://schrts.co/GSsiYK

Just tried IE 11 and the links work!!:nuts:
 
Hi Nnutt, Sorry to hear of issues. I just tried the link you posted and it opened right up for me to see the chart. I opened it while having my Stockcharts account closed. So maybe on your end, but just not sure. :( I've never had issues with stockcharts site having too much traffic to work. TSP-Roulette confirmed links worked for him.

Please try again. Maybe its just Firefox??? Anyone know how to fix that?
 
the links work just fine for me, DBA, in FF. Not showing as hourly charts, though, just daily. probably cuz I don't have paid account?
 
Hi Nnutt, Sorry to hear of issues. I just tried the link you posted and it opened right up for me to see the chart. I opened it while having my Stockcharts account closed. So maybe on your end, but just not sure. :( I've never had issues with stockcharts site having too much traffic to work. TSP-Roulette confirmed links worked for him.

Please try again. Maybe its just Firefox??? Anyone know how to fix that?
Only happening with Firefox. Even shut off my AntiVirus for this site, it still happens? Probably something with Firefox, Nasa1974 had the same problem.
 
Sorry about that Nnutt. :( I'll try to check it out this weekend... maybe Stockcharts has a fix/setting that must be used or something. Hope you have a great weekend!
 
I was going to re-allocate and move some from S fund to I and C fund, but decided to just stick to my original allocation. I recall the last time I changed mid-stream, it did not turn out well. Starting to see weakening (as indicated by MACD histogram bars getting smaller) but I am staying in ...hope Next week continues the slow grind upward. I am getting a bit wearier about I fund … it is just looking a bit weaker than US equities. It is still making overall lower lows and lower highs if you look at trend for past few months. It is on short term uptrend but just not sure how long it will last--- will it get up 20SMA (BB midpoint) and sink further down, or will it reverse to continue up making new highs???

In any case, I am pleased with this buy so far... still digging out slowly! :rolleyes:

I hope you all have a GREAT weekend and Best Wishes on your Investments!!!!!!! :D
 
Welll...we were up but now we are down :notrust: INTRADAY: S= +.15 % / C= <.17%> / I = <.05%>
With my current allocation I am at breakeven. S fund saves the day!!! :)
 
Back
Top