DreamboatAnnie
TSP Legend
- Reaction score
- 854
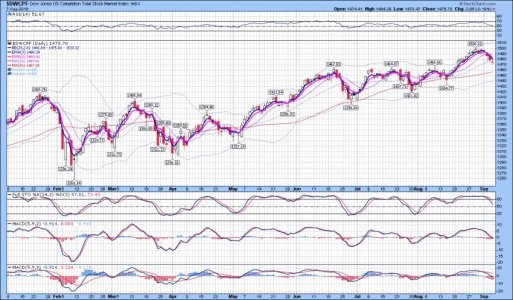
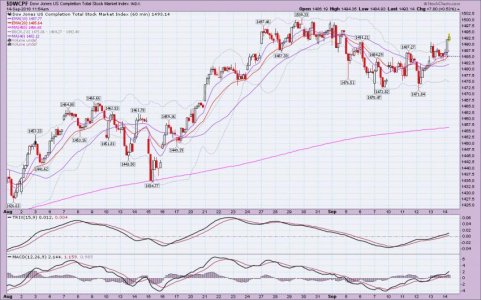
So just looking at C and S fund charts. Prices are very close to the support zones for those charts and now at about the 20-day SMA l(Bollinger Band mid-point on charts I am using). It is very close so will see how Monday goes. Chart links at posts #2217-2218 (page 185)
The Friday close for S fund was 1470.70 and the support zone is from 1462 t0v1466 (shown as chart highs for June, July and Aug).
C fund closed at 2871.68, while there is support zone at 2872.87 (Jan high) and 2863.43 (first wk in Aug)..
So price is knocking on support and I am now just watching to see it holds for an entry.
Futures are up right now, so hmmm... maybe an entry on Tuesday.
Best Wishes to you all!!!!!!! :smile:

Last edited:


