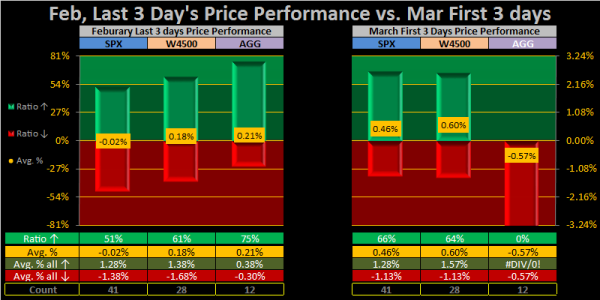
Okay. So its been awhile since I posted any charts. Here are a few.
Believe it or not, I am thinking about an entry. But will wait to see what happens tomorrow with the jobs report.
Charts are looking good, but keeping in mind that seasonality tends to not be as good the last half of month. Or at least it seems. And of course I am not forgetting we are in a overall downtrend; but recognizing we did take out the January high, but far from taking out the high we hit in Oct, Nov and Dec. BUT...We also hit resistance a few days ago at the May level for the F Fund. So that could mean more upward movement in equities.
But no question the market is smokin!!!! Wish I had stayed in (moved in and out at 40% Mon/Tues and earned .81 or so), but still felt too risky. Now it is looking better. It should hit a little rough spot for a day or two???? Drop to a Bollinger Band mid-point level or 18-20 day EMA, to where I could better consider a buy in. Its just so high right now, really do need at least a little pull back.
But what I like is how the Bollinger Bands are so bowed out (like a trumpet).... that is awesome and MACD has so much breadth above its signal line with Slow Stochastic upward.... heck both S and C funds. The only thing of concern is that Slow Stochastic is so high right now.. it typically does not embed up that high for long so I expect it to go down soon. But the BBs are so very bowed out... looks like it is on a trajectory; so while an entry now would be "chasing" it would be like chasing a train that looks like it is getting ready to take on some speed. So Price is definitely in a 10 day EMA upward channel and looks like it is staying there. Also, on one chart the 10 day EMA is getting ready to cross over the 50 EMA on both charts.. Actually it is now touching the 50 day EMA on the C fund and just slightly under it on the S fund chart. That is very good!!

Here are the 6-month DAILY charts... Enjoy!!!
S FUND (Tracks DWCPF)
Dow Jones U.S. Completion Total Stock Market Index, XX WCPF Advanced Chart - (DJW) XX
 WCPF, Dow Jones U.S. Completion Total Stock Market Index Stock Price - BigCharts.com
C FUND (Tracks SPX)
S&P 500 Index, SPX Advanced Chart - (SNC) SPX, S&P 500 Index Stock Price - BigCharts.com
Here is the F fund just for fun!!!

F FUND (Tracks AGG)
iShares Core U.S. Aggregate Bond ETF, AGG Advanced Chart - (NAR) AGG, iShares Core U.S. Aggregate Bond ETF Stock Price - BigCharts.com
NOTE TO SELF: Don't get overly excited! Market is still in an OVERALL downtrend and its risky! That means Partial Entry and Quick In and Out.
Best Wishes to Everyone on Your Investments!!!!!!!!! :smile:

