DreamboatAnnie's Account Talk

Thanks Epic! :smile: I will need to start following him.
Your very welcome. I'd say (in my opinion) he's around 77 to 80% correct for the most part. He's a bear.
There's a couple others on this forum that follow him and have managed to avoid some major losses with his predictions.
I like him cause I just don't understand Bear Markets in general.......
:embarrest:
 
Be careful about Wu, he's been pretty much 100% wrong for about 6 months straight now. (I've subscribed to him since he started his service over a year ago).
He was great for the first 6 months or so, when the market was falling...but he admits to having a bearish bias (which is why he's a Panda bear) and he's just been wrong wrong wrong since the October low.
He can be uncanny in timing of tops and bottoms sometimes though.
 
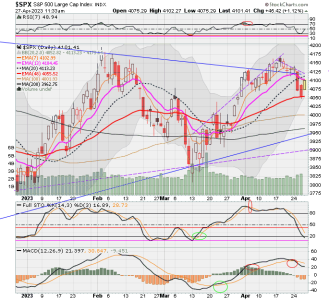
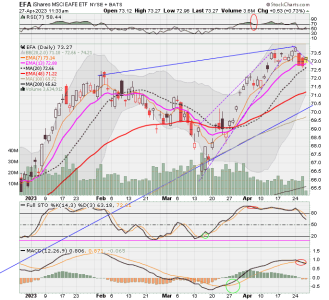
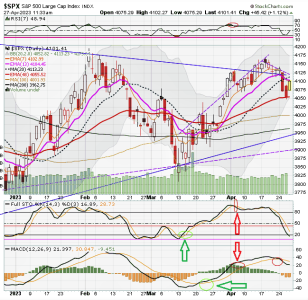
Charts before noon cutoff. So DOW viewed CPI numbers this morning to be good but TSP funds did not..and what I mean is that the 10-minute DWCPF and SPX charts pretty much showed a drop all morning (see last chart at bottom). Interesting... Best wishes to you all! :smile:

01 - S FUND - DWCPF DAILY.png

02 - C FUND - SPX DAILY.png

03 - I FUND -EFA DAILY.png

04 - F FUND - AGG DAILY.png

01 - S FUND - DWCPF DAILY.png
 
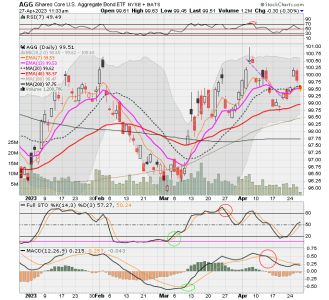
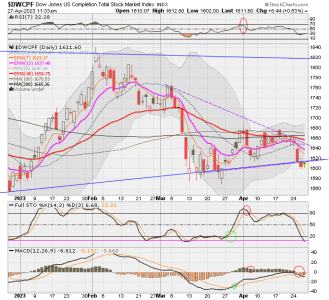
charts before noon ... Added annotations to F fund. It has crossed below its signal line on MACD (last ditch exit signal).

01 - S FUND - DWCPF DAILY.png

02 - C FUND - SPX DAILY.png

03 - I FUND -EFA DAILY.png

04 - F FUND - AGG DAILY.png
 

Attachments

  • 04 - F FUND - AGG DAILY.png
    04 - F FUND - AGG DAILY.png
    40.1 KB · Views: 207
Hi Shitepoke, I definitely think it will test mid-point of Bollinger bands. Just not sure where it goes from there. It could go back up...or down. I am waiting for it to drop below 20 on Slow Stochastic to consider reentry... And will only enter if MACD is sloped up. Right now, MACD is about to cross below it's signal line and that means further drop.... Humm...I think MACD is very good momentum indicator. If I just followed that indicator,
I could do pretty good!

Talk of recession seems to indicate longer term declines due to lower profits for companies. So don't see how it goes up long term until economy that gets better.
But short term we can still get nice rallies...waiting for reset. Ira Epstein sees mid-point of BBs as neutral zone.

Best wishes!
 
Have to say that I've never really noticed those little green circles before. Just never caught my eye, but NOW that I know they're there, Imma have to wait till I see them pop up again and try my luck. Seems like a good play, and I'm tired of just sittin in G-Fund all the time.
111.PNG
 
Here are charts before cutoff.

S fund starting to look promising as SloSto below pink line and RSI rising but MACD is still below its signal line.

C fund has not yet reached pink line on Slow Sto but its below 20(promising for entry) and RSI is already rising. MACD still below its signal line :(.

Will see about entry tomorrow but questioning whether I can stick with latest strategy of no entry if MACD has not crossed above its signal line. Hummmm....ugghhh...so tempted! :D. Eeeeee... Raven and Epic...no green circles yet!
01 - S FUND - DWCPF DAILY.png

02 - C FUND - SPX DAILY.png

03 - I FUND -EFA DAILY.png

04 - F FUND - AGG DAILY.png
 
Last edited:
Hummmm....ugghhh...so tempted! :D. Eeeeee... Raven and Epic...no green circles yet!

​The GREEN and RED circles are fairly consistent from chart to chart as being decent indicators for when to get in and get out.
GnRcircles.PNG

Take a chance if your feeling so inclined. Who knows...... :dunno:
As for me, I'm gonna ..........
111.PNG:headbang::headbang:

 
Back
Top