DreamboatAnnie's Account Talk

okay. I saw files showing as images when loaded just like before. I now exited, logged out and came back in and can see them. So not sure what is going on. I am thinking the file size is too big. Will reduce file sizes. Same thing seems to have happened with Triumph ticket, but if you click you can see that image.
 
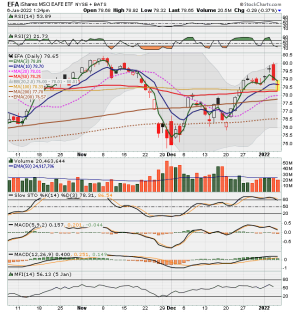
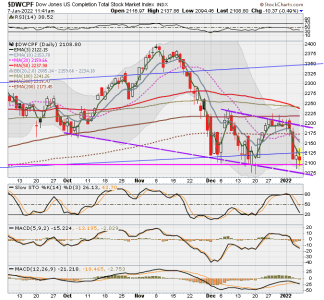
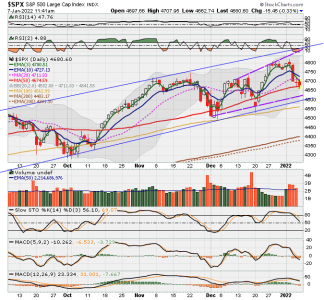
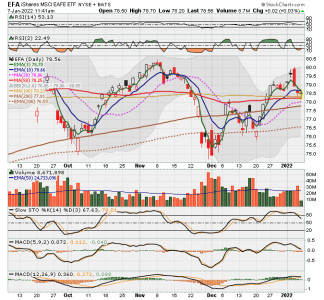
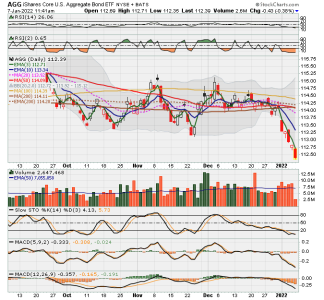
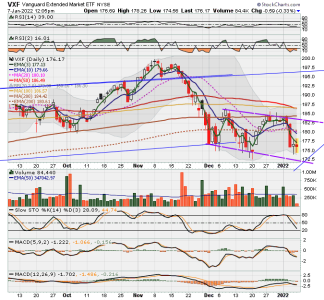
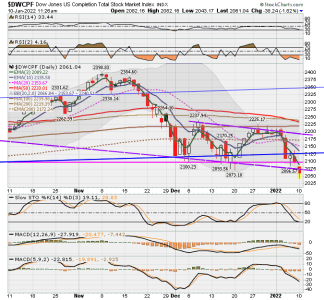
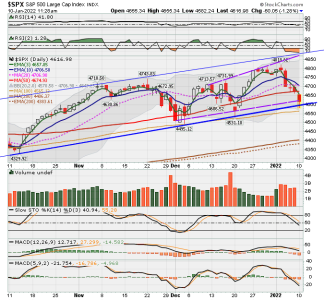
Here are charts... Hoping it loads okay. All stochastics dropping and I always try to not enter until it gets to 20 or below, and then look at daily candle formation and for divergence with volume, VIX, and percent of S&P stocks above 50 and direction...new strategy for FY 22. For volume on S fund I have started looking at volume on VXF, Vanguard extended ETF, since DWCPF does not have volume info. Also using 3 EMA more often to try spotting short-term tops.

S FUND - DWCPF DAILY.png


C FUND - SPX DAILY.png


I FUND - EFA DAILY.png


F FUND - AGG DAILY.png
 
Last edited:
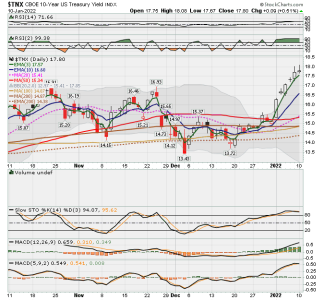
This Wednesday the CPI numbers come out in the morning followed by Producer price index in Thursday. Those are numbers, aside from Treasury yields, tgag may move markets.
 
I think too, the big guys were jockeying positions last week after returning; so, we're more likely to get numbers that can be better relied upon this week.
 
Also, Chairman Powell is undergoing confirmation hearing tomorrow. So that, plus possible market-moving CPI & PPI numbers on Wednesday and Thursday will likely cause me to stay on Lillypad a bit longer. I know money could be made if there is a good bounce but believe it best to hold out and wait for clearer market direction. Will see if shakeout continues. I would hope earnings reports would support the market.

I have heard a few folks indicating on FBN that yields could rise to as much as 2.25% by year's end. I should think that would cause continued issues.
But you just never know what will happen next.... Taiwan, Ukraine and another New variant reported this morning. hummm....

Best wishes to Everyone!
 
S-Fund at the lower Bollinger Band and just oversold (not embedded), and C-Fund also almost there as well. They both may get a bounce back to the 18 day average while I-Fund still has a ways to go before hitting the lower Bollinger Band.
It's insane how the market totally freaks out over a bunch of "talk" about what may happen in another 10 weeks. Nothing physically has happened yet. Nothing has changed.
Powell speaks and this is what the Market does. What the hell????? :blink:
cat-running-away.gif
 
Charts asof a few mins ago. Believe it or not, I am considering entry due to candle formation in last 30 minutes. I like the tail...hummm.. C fund had been below longer term line but in last 30 minutes it has risen and now within the lower trend line. I will probably still hold out...

S FUND - DWCPF DAILY.png

C FUND - SPX DAILY.png
 
Gosh Raven, Not sure why charts fail to load. On my end they show after I hit submit button. But after logging out and coming back in just now, I see those longer term charts did not post. Hummm...

Received the following when trying to view your attachments...:(

[h=2]vBulletin Message[/h]Invalid Attachment specified. If you followed a valid link, please notify the administrator
 
Hey, hey, hey! Your not allowed to say "I like the tail". That's a guys line...:nuts:

On a good note though, I can see the charts. Thanks for reposting them! :D
 
Lol... Now now Raven don't get your feathers all ruffled up. :rolleyes:
Gosh...those are the 3 month charts...I will repost the 8 month charts in a bit. :D
 
These are harder to see, but you can see general trend. As I mentioned earlier, A drop below the longer term (Blue) trend line is significant and that happened on S fund about 3 business days ago. The C fund did breach its longer term trendline earlier today, but has now popped back up and support near that line. See the 3-month charts for a closer look. Slow Stochastic still headed downward towards 20. Will wait to see what happens next.


View attachment 52679


View attachment 52680
 
Hi Epic, the market definitely hangs on what the Fed says. But also, it us getting affected by Treasury yields going up and many experts believing it will continue up and that indicates recession. Haven't looked at yields today....humm..

S-Fund at the lower Bollinger Band and just oversold (not embedded), and C-Fund also almost there as well. They both may get a bounce back to the 18 day average while I-Fund still has a ways to go before hitting the lower Bollinger Band.
It's insane how the market totally freaks out over a bunch of "talk" about what may happen in another 10 weeks. Nothing physically has happened yet. Nothing has changed.
Powell speaks and this is what the Market does. What the hell????? :blink:
cat-running-away.gif
 
Back
Top