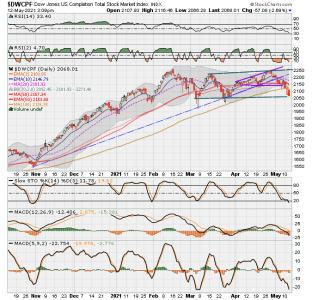
Like they say "It's not over until it's over".
I don't believe we have hit a bottom yet. Hard to say though.
The Forum works well on MOBILE devices without an app: Just go to: https://forum.tsptalk.com
Please read our AutoTracker policy on the
IFT deadline and remaining active. Thanks!
$ - Premium Service Content (Info) | AutoTracker Monthly Winners | Is Gmail et al, Blocking Our emails?
Find us on: Facebook & X | Posting Copyrighted Material
Join the TSP Talk AutoTracker: How to Get Started | Login | Main AutoTracker Page
Like they say "It's not over until it's over".
I added note (to the above description) on closing prices for the less common candles and which part of body shows closing price (opposite end). Had to mention because when it turned to empty red intraday from a solid red, I did a double take as I thought there was a mistake and then remembered! ugghh... Lol...Note - Explanation on candlesticks:
Candlestick Colors- BLACK versus RED -
BLACK means it closed higher than previous candlestick's close.
RED means it closed lower than previous close.
Candlestick Fill - EMPTY versus FILLED Candle -
EMPTY candle means it closed higher than it opened (i.e. price started at bottom of candle and ended at top of candle).
SOLID candle means it closed lower than it opened (i.e. price started at top of candle and ended at bottom of candle).
Typically you get SOLID RED and EMPTY BLACK candles.
Less Common:
SOLID Black forms when price gaps up (at start of period) and then falls, but was still above close from prior period (e.g. prior day on daily chart). Note: So, Price closes at bottom of black solid candle body (not at top).
EMPTY Red forms when price gaps down (at start of period) and then goes up, but was still below prior period close (e.g. prior day on daily chart). Note: So, Price closes at top of red empty candle body (not at bottom).

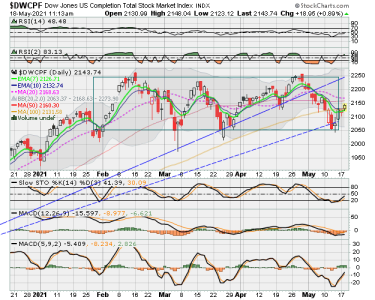
Hi MMK, Check out this chart. We have not yet hit the double bottoms of March(but we are very close), and we've been trading in about a 10% channel since the start of February. Tons of volatility... but we've not broken through Match bottoms. It could do anything! All depends on fear and how much folks believe that the overall trend will continue up. I will wait until I see a good glimmer of an uptrend or some kind of price divergence with VIX or RSI....if I can spot it. I should think we will get a little bounce tomorrow, but not sure if that ends this little (possibly short) down trend. Will see...:smile: Best wishes to you all.
PS. oh, if it breaks below March bottoms, next support would seem to be the later December month high around 2020 or so... me thinks! Remember I am not an expert....
View attachment 49208


