Several years ago, I got into an interesting discussion with another "TSP Talkster" ... I believe his name was Father Felse. He was from someplace in South Carolina down around Clemson.
Anyway, he had an interesting approach to tracking and fitting numbers to the TSP fund data. Rather than using each trading day as a point, he was using calendar days. Let me see if I
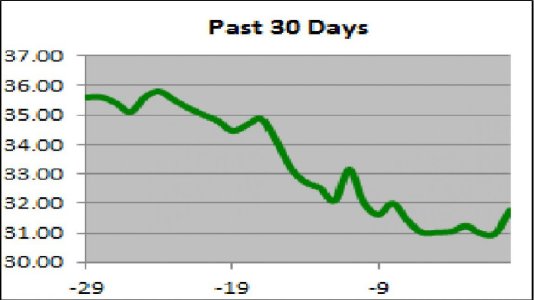
can explain. Earlier this week, we had a TSP holiday: Martin Luther King day. So his price chart ( for the S fund ) looked like this:

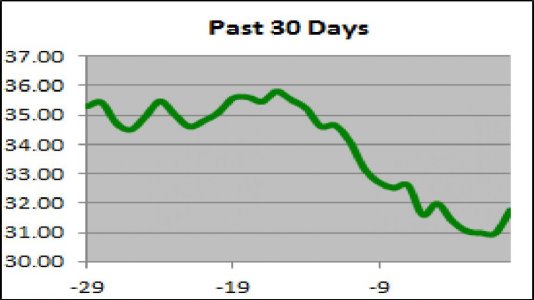
Whereas if you used a data point for each TRADING day, the chart looks like this:

Concentrate on the lower right of the charts. You'll see that using calendar days for your data points adds a calming influence on the charts - big swings taking place over the weekends or holidays are leveled out somewhat.
Which idea is correct? I dunno ... I think an argument can be made for both methods. But here's the salient point of this discussion ...
If you use the Calendar Days method, the S fund is signaling a BUY status, meaning it might be time to get back in. If you use the Trading Days method, the S-fund is signaling an ALERT ... meaning a change is possible.
Dan


