craigerv's Account Talk

craigerv

Member
Howdy Folks,

I've been thinking about starting an account talk thread for a while now but wasn't sure what I wanted to do with it. I've been here since August 2011 mostly just reading. Anyway, I'm a huge math nerd and love me some spreadsheets, and generally don't like following other people's advice blindly. As a result, I've been trying to develop my own simple systems for trading the TSP funds. I've tried out a few so far and they all do well on the back test but I'm interested to see how well they do live. I think I'm going to use this thread to post signals and results, mostly for myself, to stay on top of it. Questions and advice are welcomed. Cheers!
 
The first couple I tried were all SMAs, but I have since gone with EMAs. EMAs give me more of a feel for momentum. I haven't gone back yet to see if I can improve my technique with SMAs. I'll explain some of the signals I use later when I have some time to figure out how best to post what I want to show.
 
Welcome! I use an Excel based spreadsheet that calculates various technical indicators. There are several PICs included in my account talk thread. If you send me a PM with your email address, I can send a copy over to you. I'd also be interested in seeing your spreadsheet as well.
 
This big of a dip is pushing me much closer to a buy signal. The election results I think are more likely a short term reaction but I can't ignore the trend on the weekly SPX charts. Since mid-September we've been on the way down. The next week or two will be telling. I am anticipating buying between 1370-1385 depending on how sharp of a dip this is. Good luck everyone!
 
We're now about (5.5%) from September's high. My feeling is that we may go in a bit lower but my system will likely tell me to buy tomorrow. I may jump in half-way tomorrow and wait another week or two to see if we can get a better price.
 
My system has indicated a buy. I'm still thinking we may go down further so I'm jumping in 50% and thinking we may go lower in the next week or two.
 
My signal was on a buy as of last week's close but I thought I would wait with half of my account for a better price. I was eyeing the 1350s area and, well, here we are. Unless we get a bounce above last week's close, I'll probably buy in with the rest. Good luck!
 
Buying in with the rest, 50-50 C & S. System will remain on a buy unless we really tank from here. It's hard to tell if we're getting a Spring 2012 drop or an August 2011 correction.
 
Well, finished the year with a decent gain: +7%. I missed the early January rally last year because I was too nervous to use my systems and when I started to really fall behind I finally committed to using it. I was holding a -3.5% return YTD when I decided to use the system in late May. Since then I put in a 12% return and finished the year on a positive note. This year was the first year I tracked it live and it did really well so I'm anxious to see how things shake out this year. Good luck to the TSPTalkers and may the system be with you!
 
Looks like we paused at the 15th floor just long enough for a few more folks to get on the elevator. Lets hope we continue to head up.
 
Topping Worries:

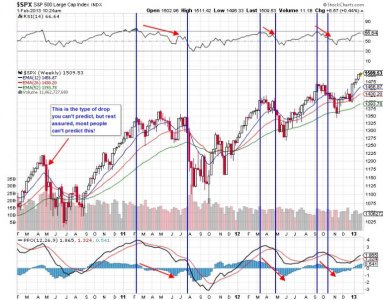
Most of the market tops that we've seen evolve over at least a few weeks. As you can see from the weekly S&P, we've had ample warning before the last three market tops using simple indicators. Once the trading became choppy, both RSI and MACD (PPO) ticked down before the longest part of the drop. The one you'll notice on the left is from '09, the flash crash. That is the one you can't really prepare for, but you did get a chance the week after to sell the rebound before more damage occurred. For the bigger correction we saw in 2011, you had MONTHS before the eventual slide.

2013-02-01_Topping_Timing.jpg
 
Animal spirits will save us all - you can be sure of that. There is a big dust cloud forming in the distance as the bullish buying herd approaches.
 
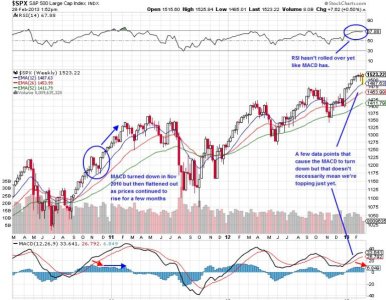
I try not to let a data point or two spook me into a signal change. Here you can see that MACD is rolling over, certainly a sign, but it's only a result of the last two data points. In Fall 2010 a similar hiccup happened but then MACD flattened out and the market continued up for a few months. I like to wait and let a top play out for a little bit before changing my long signal. Sequestration is certainly unknown territory but I'll let the charts tell me how the market digests it. I'm still long in S.
 

Attachments

  • 20130228.jpg
    20130228.jpg
    98.8 KB · Views: 267
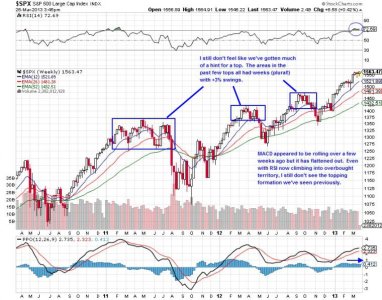
Well I don't really know what else to say except that this chart still looks fine to me. There has been a little groaning a few weeks ago and more recently about the charts flattening out and possibly topping. I don't see that yet. In the past couple of dips we've seen the tops get pretty choppy for weeks to months, not just for one or two data points. One of the reasons I like weekly charts is because it helps me not freak out about 3 down days in a row. I mean we are up +12% so far this year. When prices start nearing the 12 week ema and we get a few bigger price movements week to week then I think we will be able to see a top clearly forming.

2013-03-26_Still_Going_Up.jpg
 
Back
Top