Last week the charts for the Top 50 and the Total Tracker showed a very high level of bond exposure with stocks being largely shunned. What did the market do? Rally.
This week, the Top 50 reversed course in a big way. The Total Tracker also showed a reversal, but not nearly as pronounced.


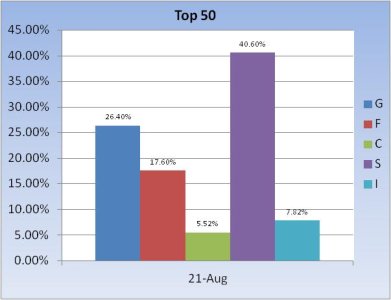
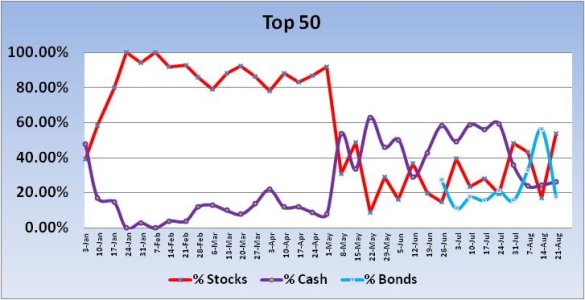
Last week the Top 50 had a collective bond allocation of 56.3%. This week that allocation fell to 17.6%. Stock allocations last week totaled an anemic 17.2%, but this week that number jumped to 53.94%. That's the largest stock allocation for this group since the week of 30 April.


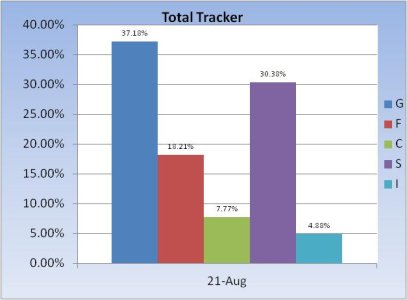
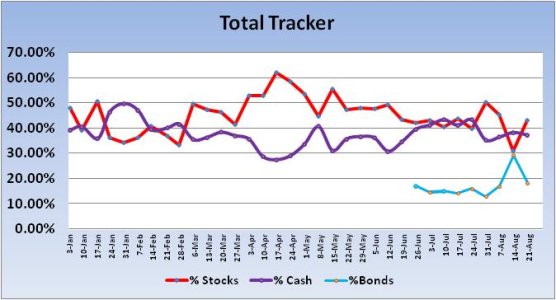
The Total Tracker also saw a drop in bond allocations, falling from 29.17% to 18.21%. Stock allocations rose from 31.08% to 43.03%.
Our sentiment survey remained in a buy condition going into the new week.
Overall, our collective stock exposure still shows we do not trust this market in spite of rising stock prices. We're due for a pullback, but I'm beginning to think we may see the kind of action we saw in the 1st quarter when pullbacks were shallow and quickly bought.
This week, the Top 50 reversed course in a big way. The Total Tracker also showed a reversal, but not nearly as pronounced.


Last week the Top 50 had a collective bond allocation of 56.3%. This week that allocation fell to 17.6%. Stock allocations last week totaled an anemic 17.2%, but this week that number jumped to 53.94%. That's the largest stock allocation for this group since the week of 30 April.


The Total Tracker also saw a drop in bond allocations, falling from 29.17% to 18.21%. Stock allocations rose from 31.08% to 43.03%.
Our sentiment survey remained in a buy condition going into the new week.
Overall, our collective stock exposure still shows we do not trust this market in spite of rising stock prices. We're due for a pullback, but I'm beginning to think we may see the kind of action we saw in the 1st quarter when pullbacks were shallow and quickly bought.
