Last week, the Top 50 increased their stock allocations by 13.6% from a modest 26.8% to 40.4%. That bullishness was rewarded with declines of 1.28% and 1.48% in the S and C funds respectively. This is on a week over week basis.
The Total Tracker showed only a modest stock allocation increase of 2.95%, but their total allocation was a bit higher (46.75%) than that of the Top 50.
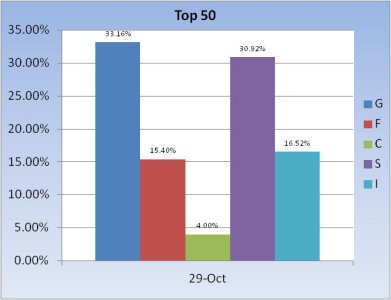
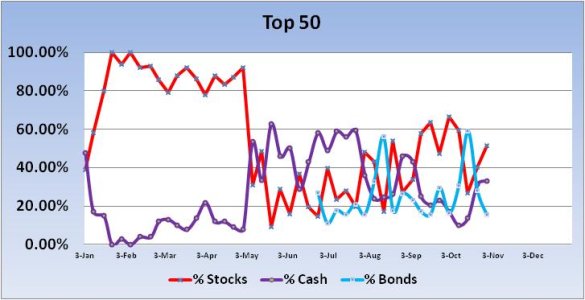
This week, the Top 50 up'd their stock allocation again, this time by 11.04% to a total stock allocation of 51.44%.
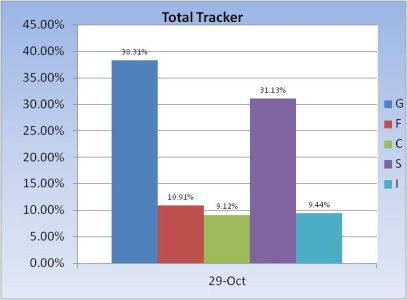
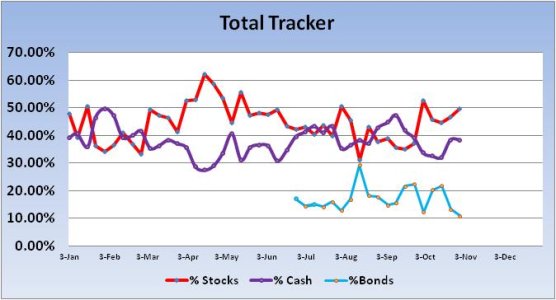
The Total Tracker also showed an increase in stock allocations, rising 2.95% to a total allocation of 49.7%.
Our sentiment survey remained on a buy for the new week as bulls outnumbered bears 49% to 40%.
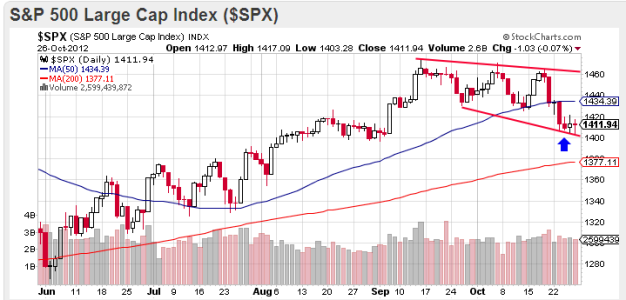
What can we expect next week? Here's a chart of the S&P 500 which shows declining prices since mid-September. Last week, prices dropped well below the 50 dma, but have found support around the 1411 area (blue arrow). This could be portending at least a short term bounce, which could see prices move back up to the 50 dma area. But with volatility on the high side, it could be difficult to trade should it happen.
The bullish expectation that prices will rise into the election has certainly not been the case to this point. Perhaps that should not be a surprise given the serious unknowns that are coming closer into focus (election, fiscal cliff, tax cuts, etc.). In any event, a big move in the short term would seem to be coming. That move may not happen until November 7th though, which is the day after the election.
The Total Tracker showed only a modest stock allocation increase of 2.95%, but their total allocation was a bit higher (46.75%) than that of the Top 50.


This week, the Top 50 up'd their stock allocation again, this time by 11.04% to a total stock allocation of 51.44%.


The Total Tracker also showed an increase in stock allocations, rising 2.95% to a total allocation of 49.7%.
Our sentiment survey remained on a buy for the new week as bulls outnumbered bears 49% to 40%.

What can we expect next week? Here's a chart of the S&P 500 which shows declining prices since mid-September. Last week, prices dropped well below the 50 dma, but have found support around the 1411 area (blue arrow). This could be portending at least a short term bounce, which could see prices move back up to the 50 dma area. But with volatility on the high side, it could be difficult to trade should it happen.
The bullish expectation that prices will rise into the election has certainly not been the case to this point. Perhaps that should not be a surprise given the serious unknowns that are coming closer into focus (election, fiscal cliff, tax cuts, etc.). In any event, a big move in the short term would seem to be coming. That move may not happen until November 7th though, which is the day after the election.
