Last week, a sell signal was issued for the Top 50 given this group’s 22% increase in stock allocations. I said I would disregard this signal given the relatively significant drop in allocations on the Total Tracker. That was a good call. This week, stock allocations for the Top 50 rose by 7% to a total stock allocation of 96.8%. No signal there. And the Total Tracker only saw a modest increase in stocks, rising a mere 1.06%. Here's the charts:
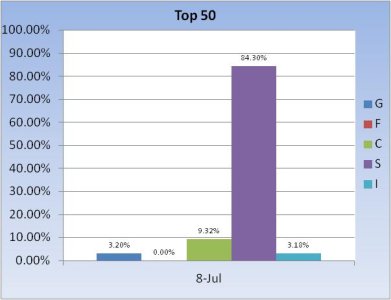
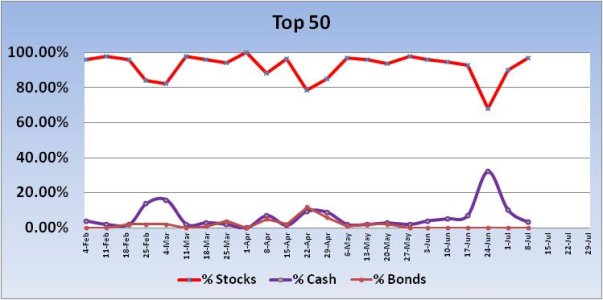
The Top 50 continue to maintain their bullish positions with a very high stock allocation.
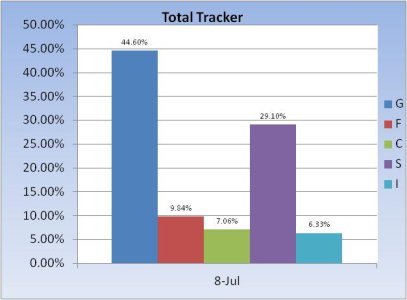
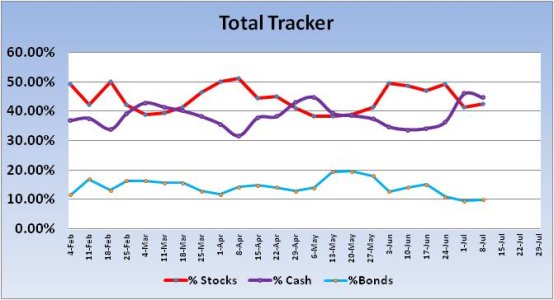
By contrast, the Total Tracker has a total stock allocation of just 42.49%. That's bullish longer term.
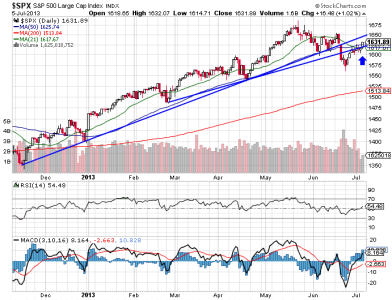
Price on the S&P 500 sliced through that lower resistance line on Friday (as well as the 50 day moving average), closing near the mid-way point to a longer term resistance line. The relative strength indicator is now positive and pointing up. MACD (momentum) is also positive and moving higher.
I didn't draw it on this chart, but there is another line of resistance from Mid-May and it is not far under that upper blue line.
Our sentiment survey saw a significant drop in bulls with a corresponding increase in bears. It's a neutral reading (the system remains on a buy) and I think it's supportive of the market for next week.
To see this week's full analysis, follow this link http://www.tsptalk.com/members/.


The Top 50 continue to maintain their bullish positions with a very high stock allocation.


By contrast, the Total Tracker has a total stock allocation of just 42.49%. That's bullish longer term.

Price on the S&P 500 sliced through that lower resistance line on Friday (as well as the 50 day moving average), closing near the mid-way point to a longer term resistance line. The relative strength indicator is now positive and pointing up. MACD (momentum) is also positive and moving higher.
I didn't draw it on this chart, but there is another line of resistance from Mid-May and it is not far under that upper blue line.
Our sentiment survey saw a significant drop in bulls with a corresponding increase in bears. It's a neutral reading (the system remains on a buy) and I think it's supportive of the market for next week.
To see this week's full analysis, follow this link http://www.tsptalk.com/members/.
