The most notable point to make for this week's tracker charts is that the herd (total tracker) got much more bullish in the wake of recent weakness (and subsequent rally). Let's look at the charts:


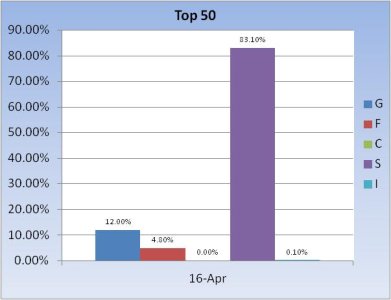
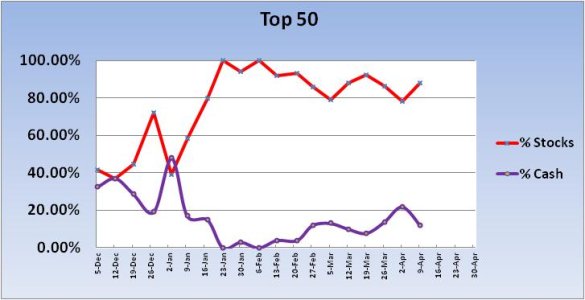
The Top 50 have been holding relatively steady for weeks now. Total stock exposure is 83.2%, although that number dipped almost 5% for the coming week.


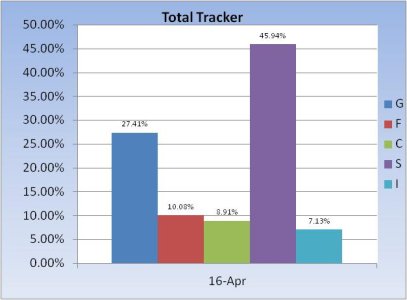
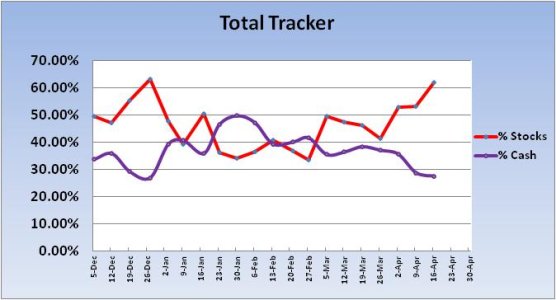
The herd ramped up their stock exposure by 9.02% to a total stock allocation of 61.98%. That's not overly bullish, but this the highest stock exposure for this group since December. And given our sentiment survey flashed a sell for the coming week (the first sell signal in 15 weeks) I'd expect to see some weakness sometime this week.
Sentiment continues to spike in various surveys depending on short term technical indicators, which is contributing to volatility.
The Seven Sentinels remain in an intermediate term sell condition.


The Top 50 have been holding relatively steady for weeks now. Total stock exposure is 83.2%, although that number dipped almost 5% for the coming week.


The herd ramped up their stock exposure by 9.02% to a total stock allocation of 61.98%. That's not overly bullish, but this the highest stock exposure for this group since December. And given our sentiment survey flashed a sell for the coming week (the first sell signal in 15 weeks) I'd expect to see some weakness sometime this week.
Sentiment continues to spike in various surveys depending on short term technical indicators, which is contributing to volatility.
The Seven Sentinels remain in an intermediate term sell condition.
