Bquat's Account Talk

What you think? Long Term:
 

Attachments

  • spx_1.jpg
    spx_1.jpg
    83.4 KB · Views: 174
  • spx_2.jpg
    spx_2.jpg
    90.9 KB · Views: 172
  • spx_3.jpg
    spx_3.jpg
    90.7 KB · Views: 172
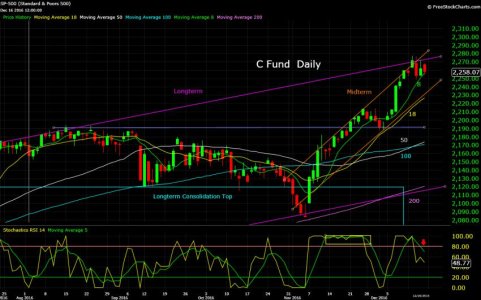
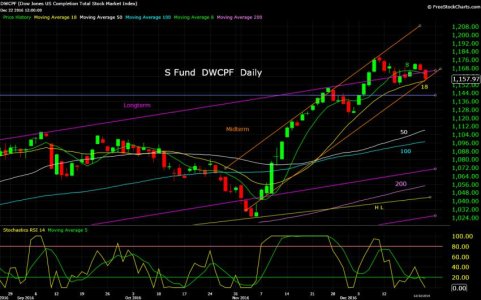
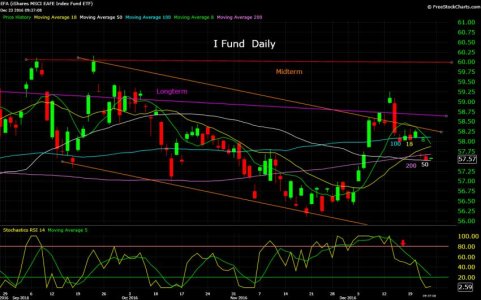
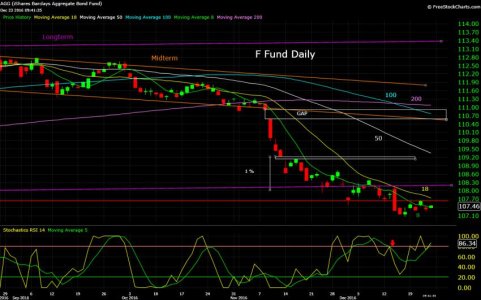
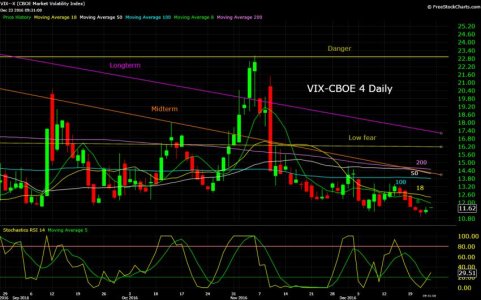
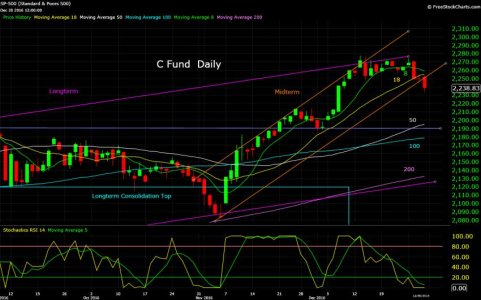
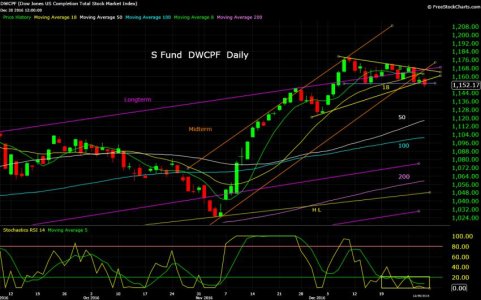
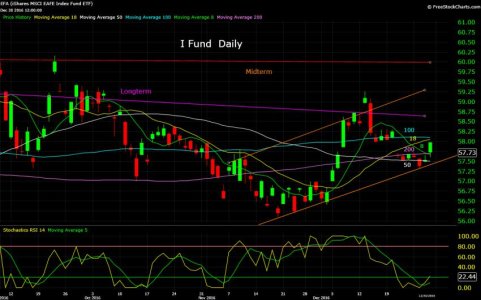
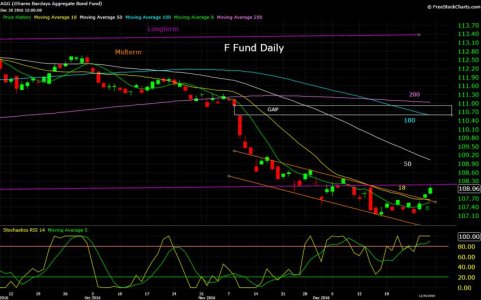
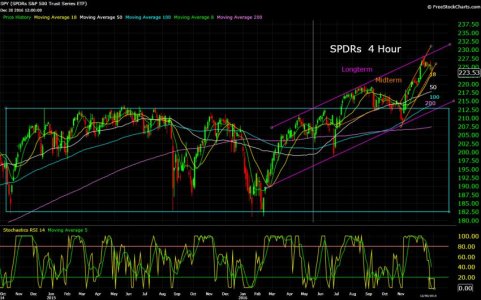
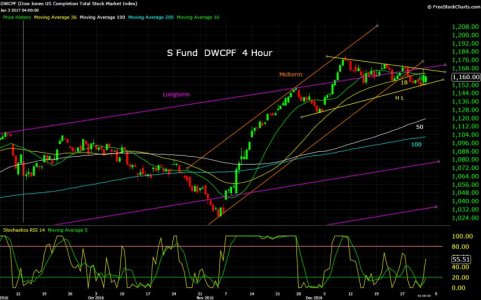
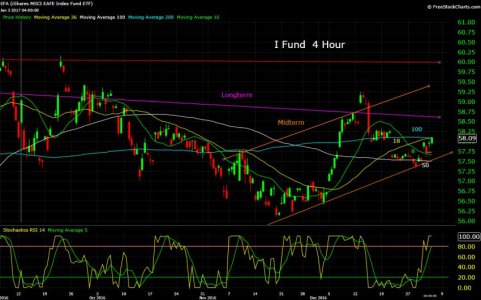
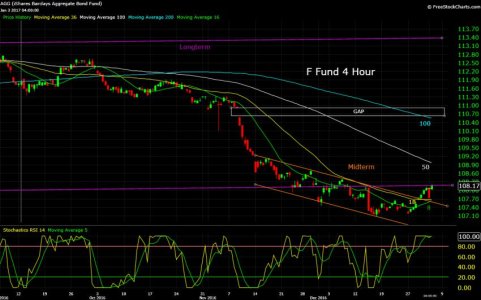
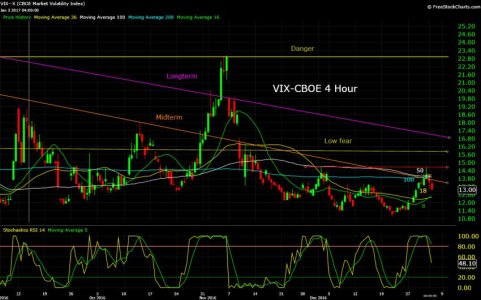
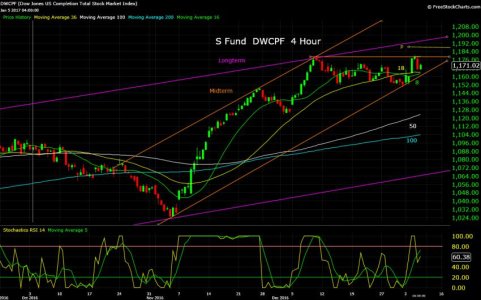
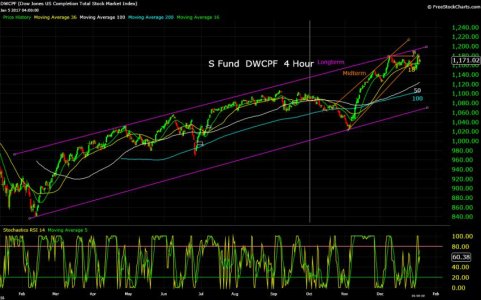
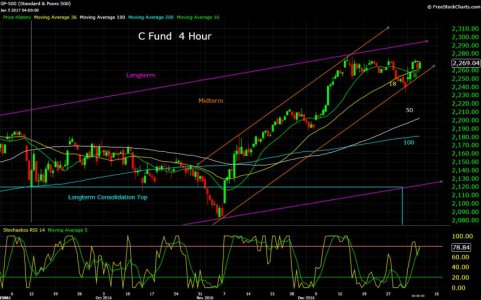
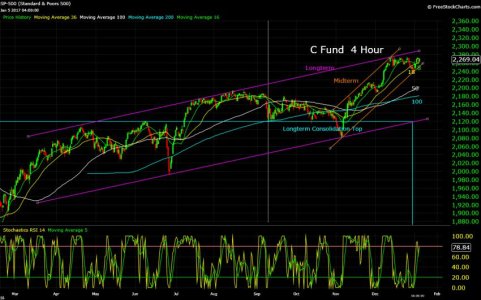
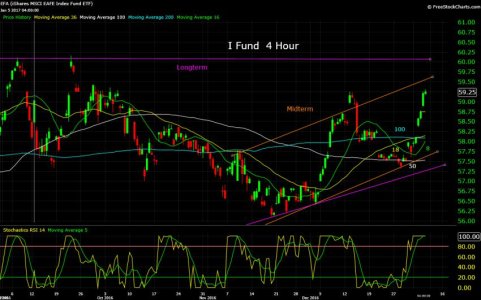
Are stocks over sold? Are Bonds over bought? Did the Trump Rally negate the Santa Rally? With no fear in the VIX can the rally restart? Did you enjoy your coffee this morning? Charts:
 

Attachments

  • S&P 500 12_23_16.jpg
    S&P 500 12_23_16.jpg
    80.4 KB · Views: 145
  • DWCPF 12_23_16.jpg
    DWCPF 12_23_16.jpg
    79.7 KB · Views: 143
  • EFA 12_23_16.jpg
    EFA 12_23_16.jpg
    76.8 KB · Views: 142
  • AGG 12_23_16.jpg
    AGG 12_23_16.jpg
    78.8 KB · Views: 140
  • VIX-X 12_23_16.jpg
    VIX-X 12_23_16.jpg
    80.5 KB · Views: 142
Thanks!!!!! I like that the rising wedge has broken down. I know it is still a potential but we will have to get more upward motion for that to happen.

And an Early Merry Christmas to you and yours!
 
BQ: Coffee was great this morning..an Ethiopian with a touch of chocolate and rare spices in the flavor...I think we still kick it and rally before year end...lots of market love this year and why sell in 2016 when you save the tax in 2017...just a bit of consolidation going on from my perspective...I still believe in Santa!!!

FS
 
Looks like a nice little pop to end today if it holds in the last 15 minutes.
Maybe we get a late Christmas next week. :banana:
 
Stocks looking a little weak entering 2017: What you think?:worried:
 

Attachments

  • S&P 500 01_01_17.jpg
    S&P 500 01_01_17.jpg
    80.3 KB · Views: 157
  • DWCPF 01_01_17.jpg
    DWCPF 01_01_17.jpg
    80.1 KB · Views: 154
  • EFA 01_01_17.jpg
    EFA 01_01_17.jpg
    74 KB · Views: 152
  • AGG 01_01_17.jpg
    AGG 01_01_17.jpg
    74.1 KB · Views: 156
SPY Longer Term:
 

Attachments

  • spy_1.jpg
    spy_1.jpg
    89.3 KB · Views: 181
  • spy_2.jpg
    spy_2.jpg
    89.7 KB · Views: 186
  • spy_3.jpg
    spy_3.jpg
    87.9 KB · Views: 183
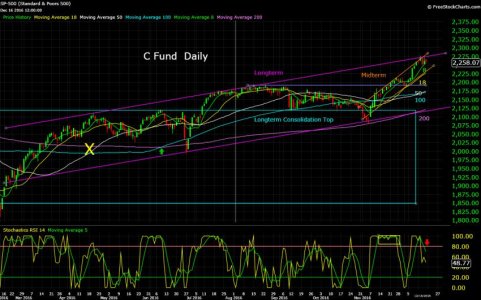
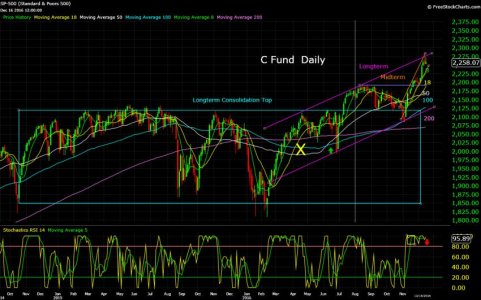
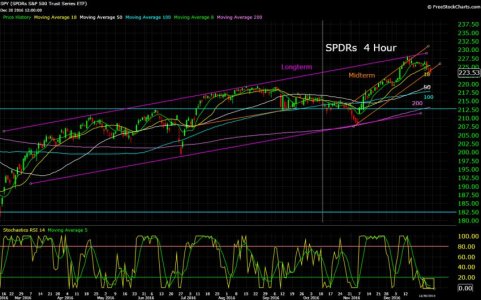
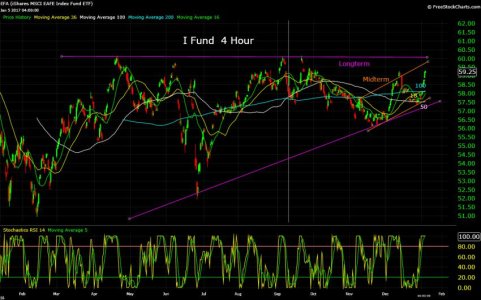
Here's what I have so far for 2017 waiting for stocks to come up into the oversold condition. Afternoon action was good::smile:
 

Attachments

  • S&P 500 01_04_17.jpg
    S&P 500 01_04_17.jpg
    82.9 KB · Views: 172
  • DWCPF 01_04_17.jpg
    DWCPF 01_04_17.jpg
    81 KB · Views: 169
  • EFA 01_04_17.jpg
    EFA 01_04_17.jpg
    76.5 KB · Views: 172
  • AGG 01_04_17.jpg
    AGG 01_04_17.jpg
    75.8 KB · Views: 168
  • VIX-X 01_01_17.jpg
    VIX-X 01_01_17.jpg
    80.3 KB · Views: 172
Working on my 2017 charts. Here's the S Fund with new long term channel:
 

Attachments

  • DWCPF 01_05_17.jpg
    DWCPF 01_05_17.jpg
    79.1 KB · Views: 159
  • DWCPF 01_05_17LT.jpg
    DWCPF 01_05_17LT.jpg
    79.1 KB · Views: 160
C Fund:
 

Attachments

  • S&P 500 01_05_17.jpg
    S&P 500 01_05_17.jpg
    83.4 KB · Views: 170
  • S&P 500 01_05_17LT.jpg
    S&P 500 01_05_17LT.jpg
    83.2 KB · Views: 172
I Fund:
 

Attachments

  • EFA 01_05_17.jpg
    EFA 01_05_17.jpg
    77.7 KB · Views: 171
  • EFA 01_05_17LT.jpg
    EFA 01_05_17LT.jpg
    82.3 KB · Views: 169
F Fund is weird. I may have to redo it with no long term and it looks like a cup and handle forming:
 

Attachments

  • AGG 01_05_17.jpg
    AGG 01_05_17.jpg
    76.9 KB · Views: 193
  • AGG 01_05_17LT.jpg
    AGG 01_05_17LT.jpg
    80.9 KB · Views: 193
With the approaching weakness in seasonality, the F train may be the place to be seeing these gaps, at least for a short stint. Thanks Bquat.
 
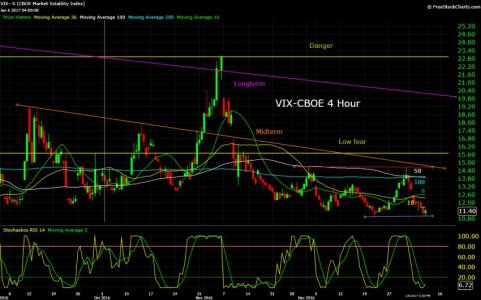
Haven't done a VIX chart lately. Remember I stopped using channels in the VIX but using potential long term and midterm resistance points. I don't know if its good or bad but I have noticed the 100 and 50 day is below the low fear level::suspicious:
 

Attachments

  • VIX-X 01_08_17.jpg
    VIX-X 01_08_17.jpg
    80.5 KB · Views: 180
That VIX chart will probably rise pretty quickly as the rising wedge on the SnP reforms. Maybe next week, just in time for inauguration...
 
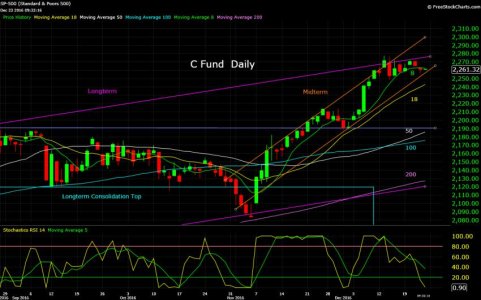
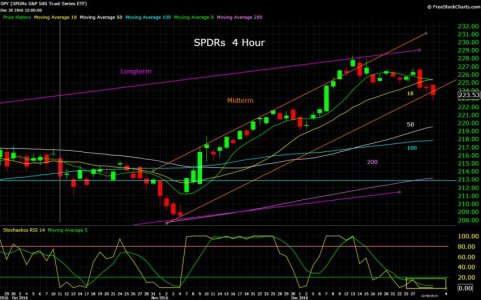
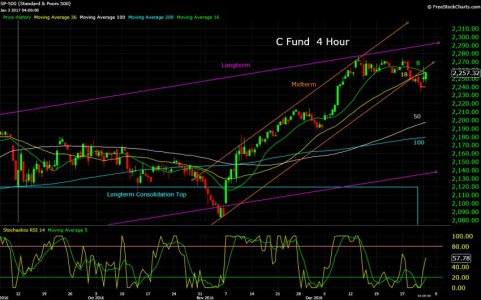
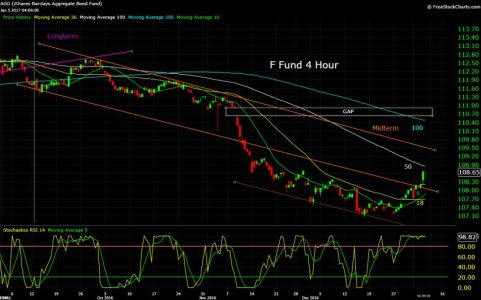
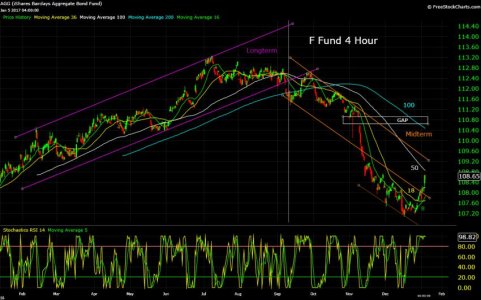
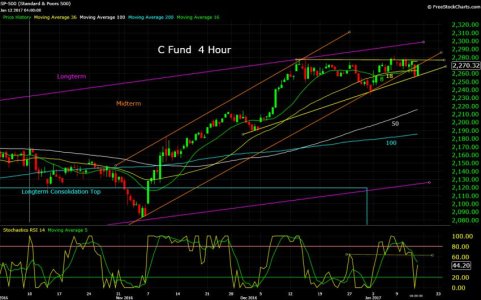
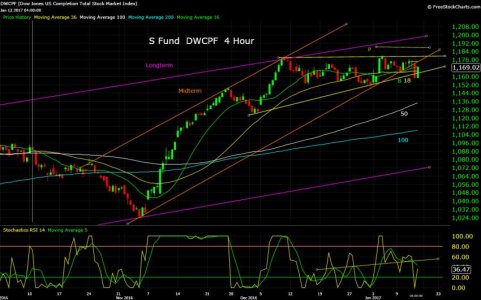
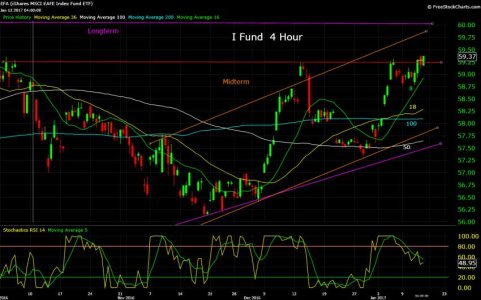
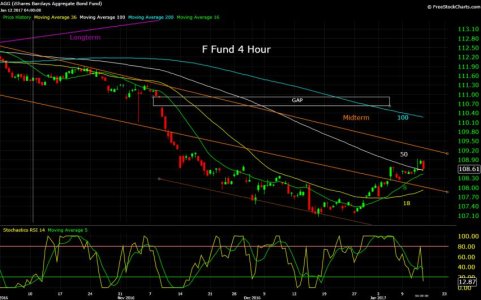
So tomorrow is Friday the 13th. Normally a good day for me. So what do you think will happen on stocks. Will they continue to fall out of the Midterm channel (orange)or will the yellow ascending triangle (yellow) work? Will bonds ever get back up to the 100 Day to maybe complete a cup and handle pattern? The charts:
 

Attachments

  • S&P 500 01_13_17.jpg
    S&P 500 01_13_17.jpg
    82.6 KB · Views: 151
  • DWCPF 01_13_17.jpg
    DWCPF 01_13_17.jpg
    80.4 KB · Views: 149
  • EFA 01_13_17.jpg
    EFA 01_13_17.jpg
    76.1 KB · Views: 147
  • AGG 01_13_17.jpg
    AGG 01_13_17.jpg
    75.9 KB · Views: 150
Looks like we are getting the pre-holiday run up which means it will probably fall back down on Tuesday. Then again, I didn't think MLK day was one of those times that gave us the holiday effect. :notrust:
 
Back
Top