Bquat
TSP Talk Royalty
- Reaction score
- 815
The Forum works well on MOBILE devices without an app: Just go to: https://forum.tsptalk.com
Please read our AutoTracker policy on the
IFT deadline and remaining active. Thanks!
$ - Premium Service Content (Info) | AutoTracker Monthly Winners | Is Gmail et al, Blocking Our emails?
Find us on: Facebook & X | Posting Copyrighted Material
Join the TSP Talk AutoTracker: How to Get Started | Login | Main AutoTracker Page
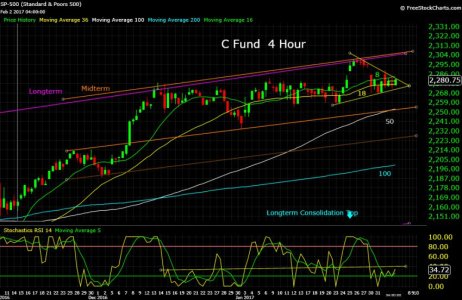
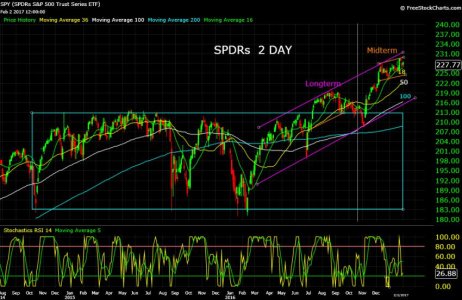
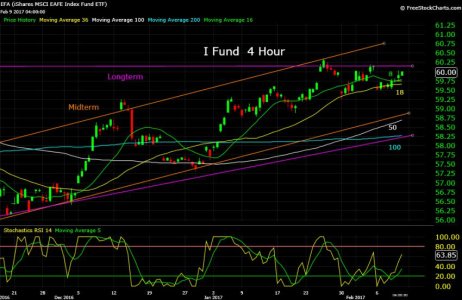
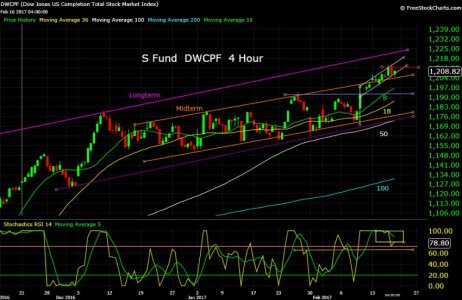
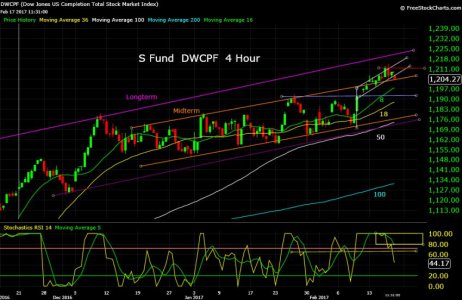
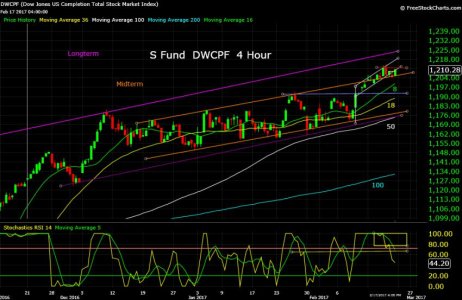
Went from price range rectangles back to trend channels Midterm. Stocks are coiling:
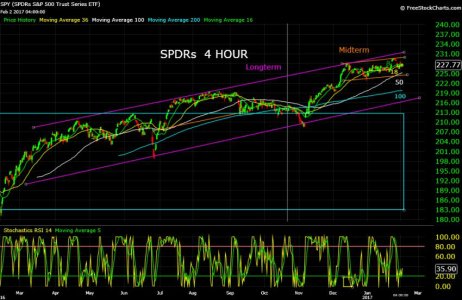
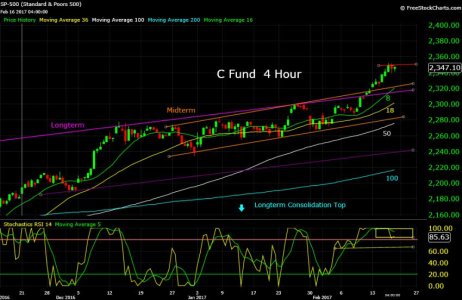
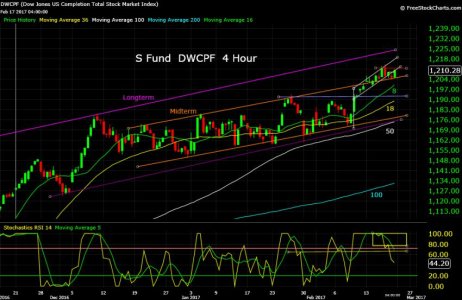
The values at top in that chart haven't been adjusted and would be correct for the 4 hour time frame. In the longer charts the 200 and 50 day are important because many look for the cross of the 50 over the 200 as a bullish or bearish trend. In most time frames many take the slope of the fifty as an increase or decrease of fear. IE: If the current trend is down, when price gets to a declining fifty day it has a better chance of crossing it. Whereas if the fifty day has an upward slop the odds are that a correction will bounce back up off of it. Many use the 20 or 18 day as current trend direction. The 100 day is used for where bigger corrections can bounce. I could be slightly wrong on this but you can figure which ones are best for you by watching the videos Nnuut posts daily. Maybe the next time I do the long term I might take the time to adjust them.Bquat, what are the best moving averages based on time frame? Still trying to figure that out. Thanks!

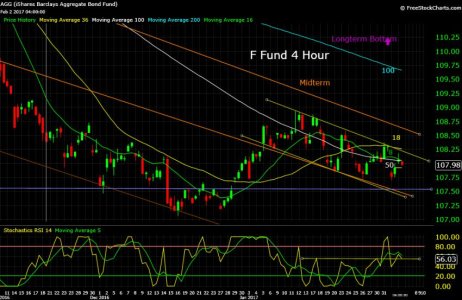
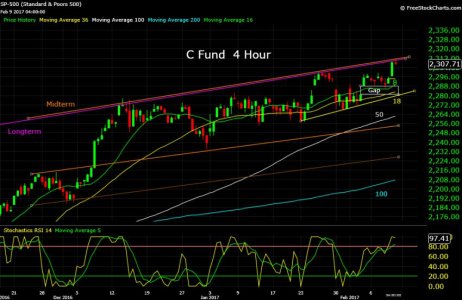
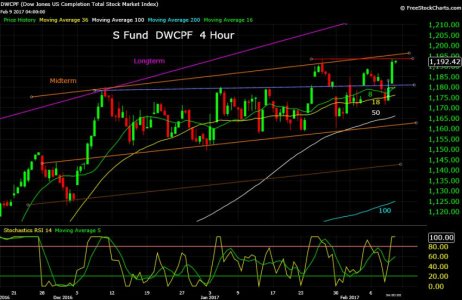
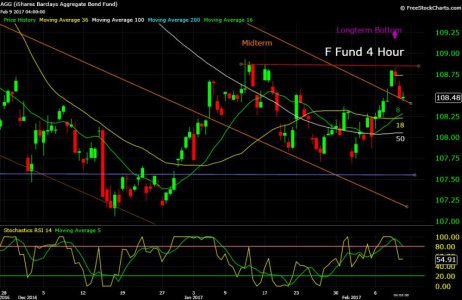
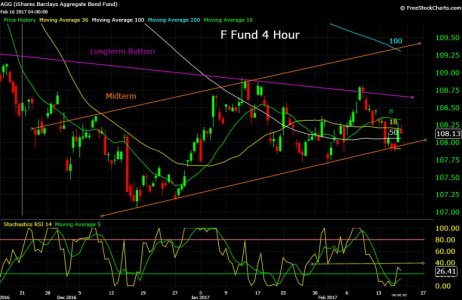
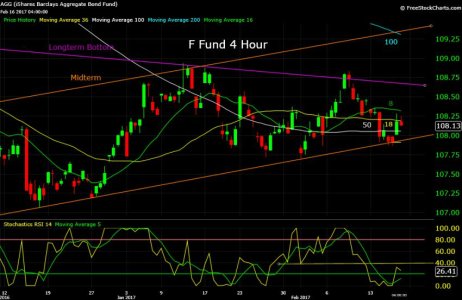
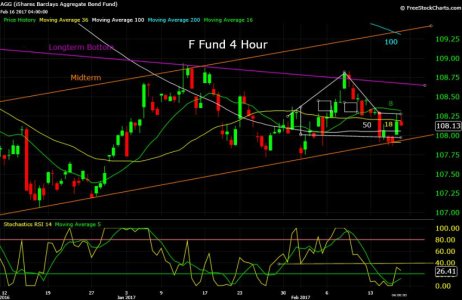
F flag is bullish until it breaks. Is that happening now? Yesterday all weakness was bought up but by the yellow crossing yellow line at bottom the odds are 60/40 that it should break: In this market who knows.:suspicious:Saw a lot of weakness today and saw all the dips being bought. Are stocks embedded and where is all the strength coming from?:suspicious: