-
The Forum works well on MOBILE devices without an app: Just go to: https://forum.tsptalk.com
-
Please read our AutoTracker policy on the IFT deadline and remaining active. Thanks!
-
$ - Premium Service Content (Info) | AutoTracker Monthly Winners | Is Gmail et al, Blocking Our emails?
Find us on: Facebook & X | Posting Copyrighted Material
-
Join the TSP Talk AutoTracker: How to Get Started | Login | Main AutoTracker Page
You are using an out of date browser. It may not display this or other websites correctly.
You should upgrade or use an alternative browser.
You should upgrade or use an alternative browser.
Bquat's Account Talk
- Thread starter Bquat
- Start date
Mcqlives
Market Veteran
- Reaction score
- 24
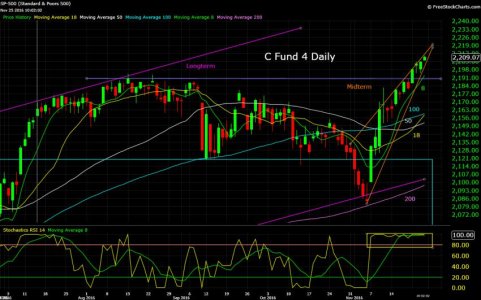
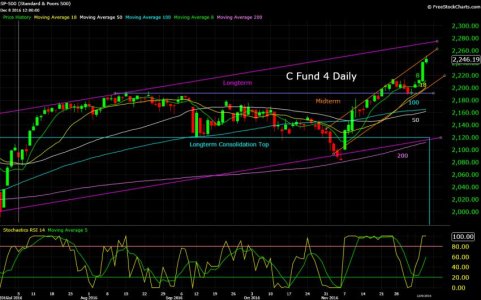
We may be at a bounce point...but I think more pain is coming. If the C fund doesn't find a floor here then around 2008-2014 is in play. Of course, all that is dependent on election results and how much pricing in the computers have done depending on the winner.
FogSailing
Market Veteran
- Reaction score
- 61
No idea BQ. Thanks for the charts BTW. I'll need ITs help to figure this one out. Sitting tight until "IT SPEAKS!" Looks like we're headed towards highs but another part of me says the action was just to burn the shorts. Just don't know.
FS
Looks like we're headed towards highs but another part of me says the action was just to burn the shorts. Just don't know.FS
Bquat
TSP Talk Royalty
- Reaction score
- 815
Bquat
TSP Talk Royalty
- Reaction score
- 815
DreamboatAnnie
TSP Legend
- Reaction score
- 1,036
I'm staying in until I start to see a breakdown via consolidation. That means at least an intraday touch of 20 EMA on a daily chart (bottom of daily wick). That said i'll probably stay in only a few more days past that point. I've most often exited too early, going against my strategy.
Best wishes to you and everyone on your investments!!!!!!! :smile:
Best wishes to you and everyone on your investments!!!!!!! :smile:
Bquat
TSP Talk Royalty
- Reaction score
- 815
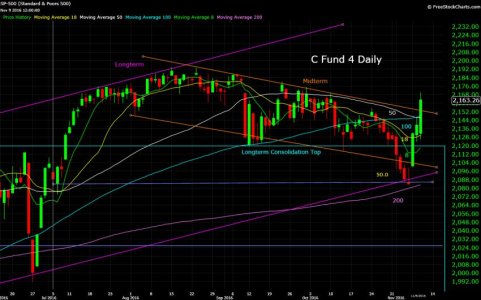
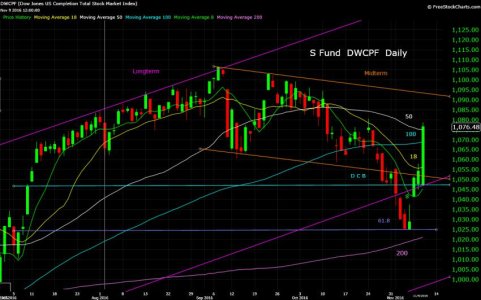
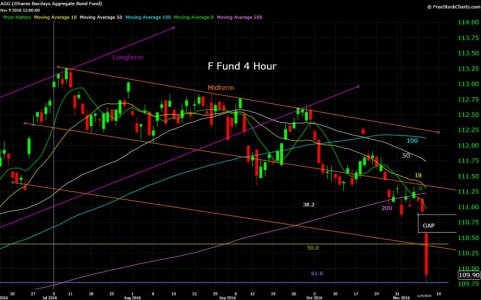
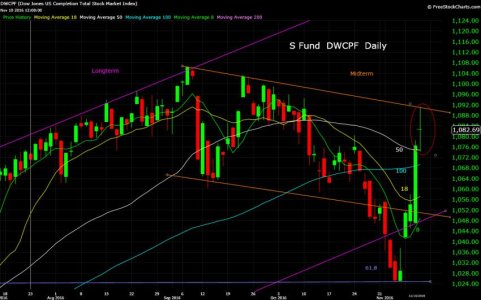
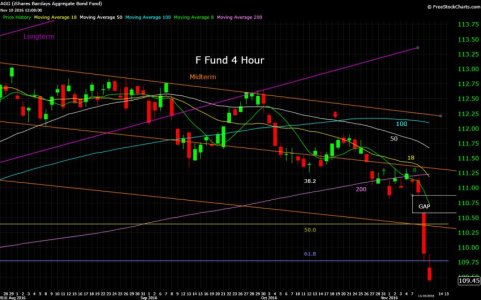
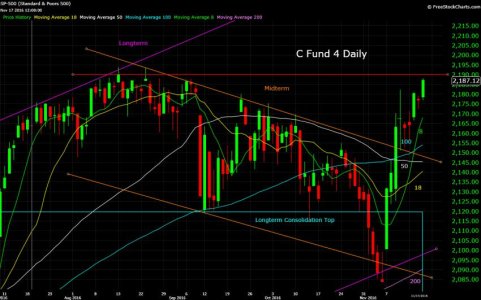
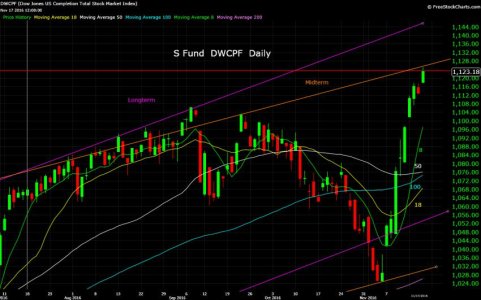
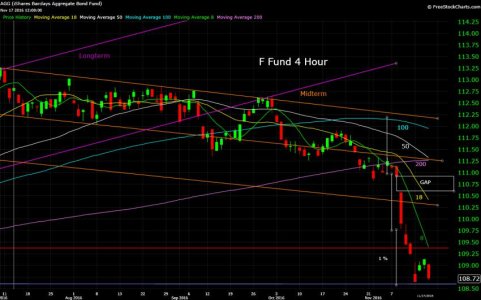
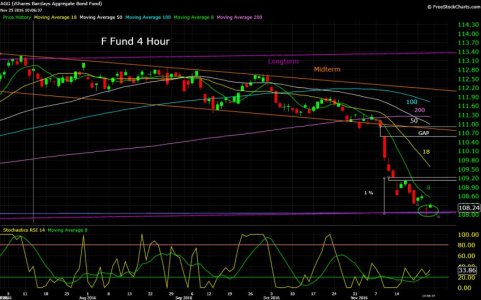
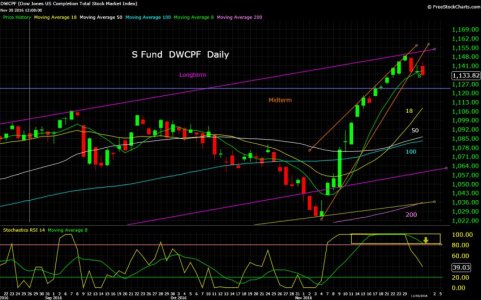
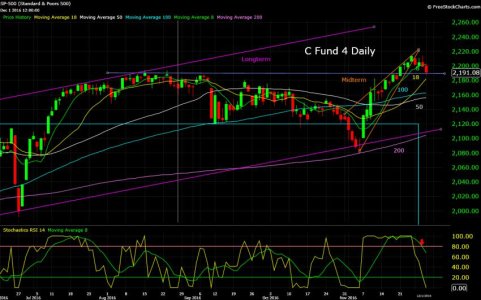
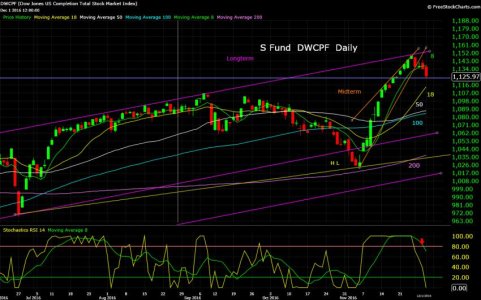
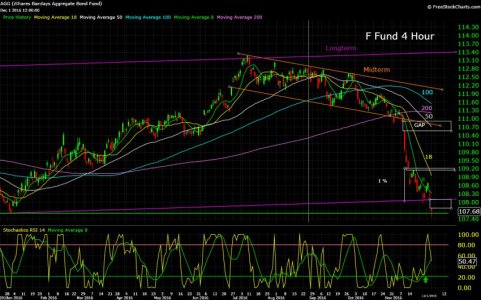
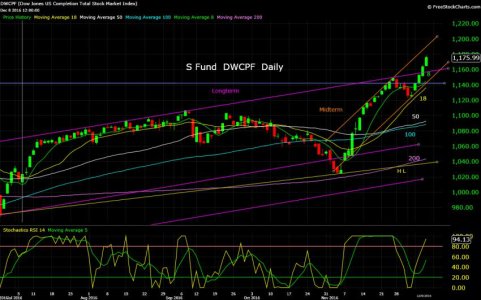
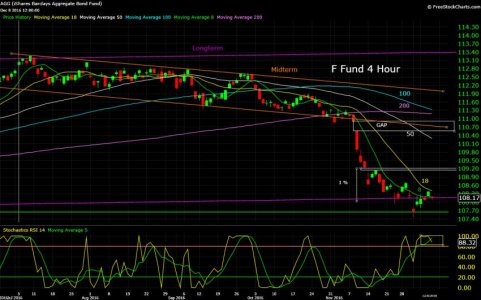
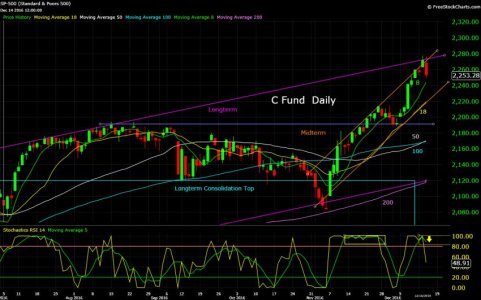
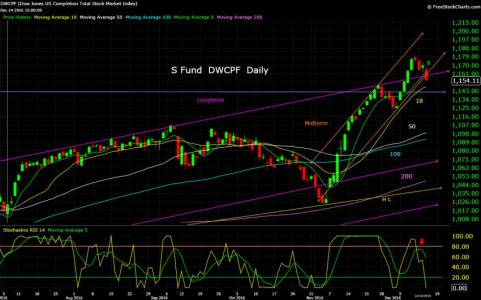
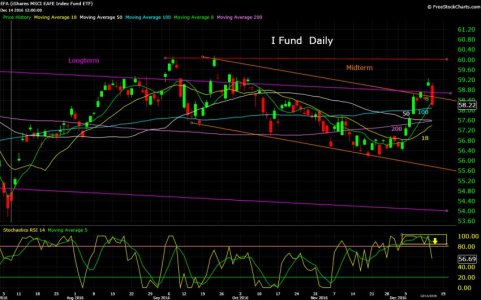
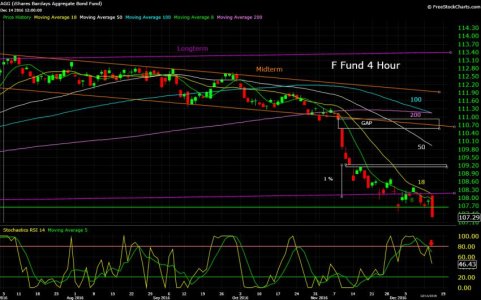
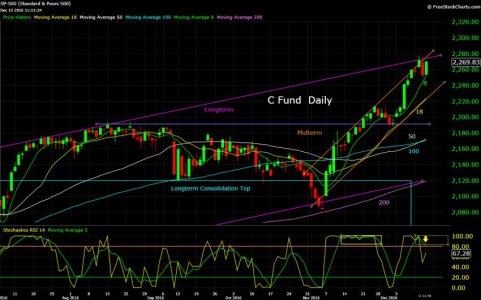
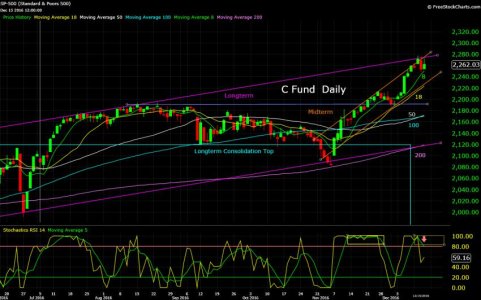
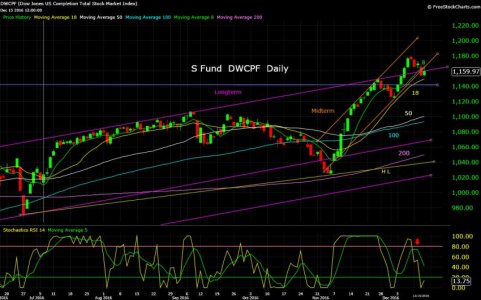
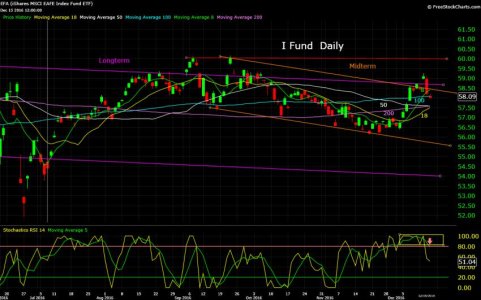
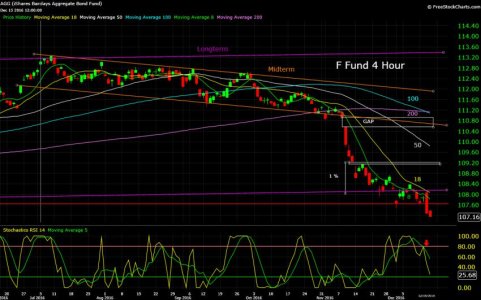
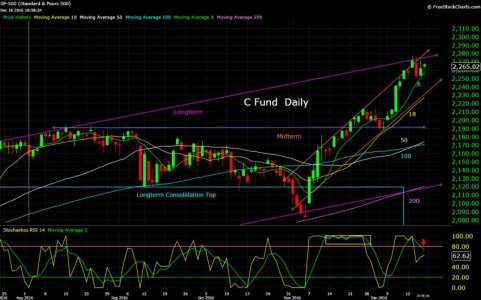
Couple of December charts just prior to market open. F Fund has broken out of being embedded and on a double bottom. S Fund is close to breaking out of being embedded but will it. News seems to be out waying charts, so we'll see:
Attachments
Bquat
TSP Talk Royalty
- Reaction score
- 815
FogSailing
Market Veteran
- Reaction score
- 61
The timing for things to turn around in the markets always amazes me. The 100% retrace in bonds is an example where you know that bonds are going to bounce because all the technicals show that the conditions are ripe...but the markets seem to contain a type of stored energy that won't allow the technical conditions to control them until all that that momentum has been expended. And because markets have skyrocketed at a steep trajectory in different directions (stocks v bonds), I think it is going to take markets longer to turn around this month.
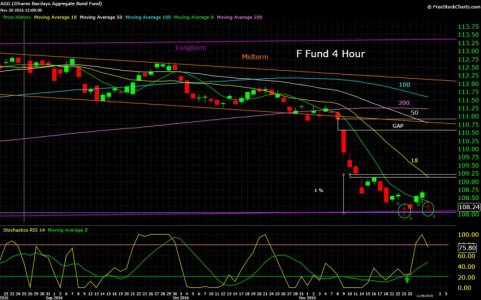
HOLD: Just checked the markets....somethings happening...bonds are actually bouncing...will wait till Monday to make the change..
FS
HOLD: Just checked the markets....somethings happening...bonds are actually bouncing...will wait till Monday to make the change..
FS
Last edited:
Tsunami
TSP Pro
- Reaction score
- 62
HOLD: Just checked the markets....somethings happening...bonds are actually bouncing...will wait till Monday to make the change..
FS
Bonds are oversold and due for a "sharp snapback rally"...
McClellan Oscillator for Corporate Bonds - Free Weekly Technical Analysis Chart - McClellan Financial
But bonds are marching to a different tune than stocks, which I think need more consolidation and a little more downside after today's small bounce. I'm looking for (hoping for) a drop into the 2160's next week to get back in, and that would actually be much healthier and more bullish for 2017.
I was looking at my YTD performance last night. Wow, call me the comeback kid. Per the Tracker, at the end of June: TSP Talk AutoTracker
I was #1680 out of 1681 at -7.65%. Now, as of 12/1/16 I’m shown as #643 of 1246 at +5.94%, a gain of 13.59%.
In my actual for reelz TSP account, at the end of June I was at -2.60% on 6/30 (equivalent to #1635)…I finally I said enough is enough and started following my system on 7/22/16, and now I’m at +9.2% (equivalent to #408 in the tracker), a gain of 11.8%, and I wonder if that’s among the best performers for the period since 6/30. Yay me!

Oh, and after today's plunge in the UE rate to 4.6%, the bull/bear market indicator that uses a 12-month moving average of the UE rate and the 10-month moving average of the S&P 500 price is solidly in bull market mode. No worries for 2017 at this point.
And in other news, I think Avi Gilbert's predictions for gold are coming true and gold has hit a bottom...good time to buy things like GDX and even NUGT or JNUG perhaps, no promises...
This is painful to say, but go Huskies! A UW win this evening over the Buffs should put my Cougs into the Holiday Bowl.
Last edited:
Bquat
TSP Talk Royalty
- Reaction score
- 815
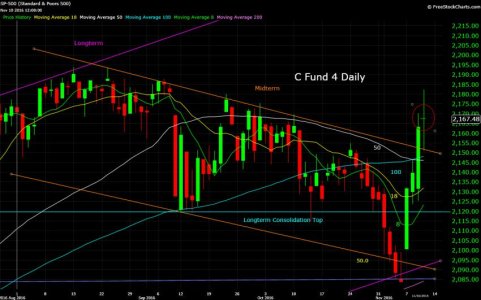
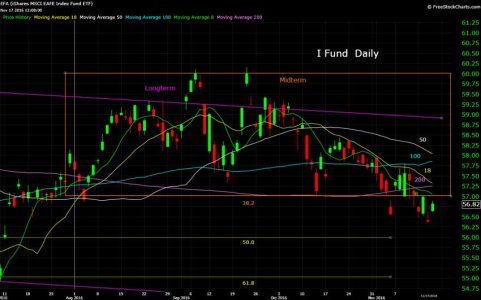
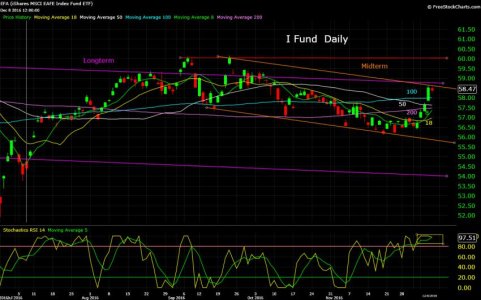
Here's the charts. Left the long term the same and changed the midterms in stocks to reflect most of the Trump rally. Can bonds embed and make it back to their midterm? Not if money continues into stocks: Comment you can.
Attachments
Bquat
TSP Talk Royalty
- Reaction score
- 815
Both stocks and bonds did not like the rate hikes announcement. With follow through tomorrow anything embedded or trying to embed will drop down into an over bought condition. So tomorrow get a pot of coffee on and watch if this was an overreaction or if profit taking takes hold:
Attachments
Bquat
TSP Talk Royalty
- Reaction score
- 815
Looks like the rate hike is being absorbed:Both stocks and bonds did not like the rate hikes announcement. With follow through tomorrow anything embedded or trying to embed will drop down into an over bought condition. So tomorrow get a pot of coffee on and watch if this was an overreaction or if profit taking takes hold:
Attachments
Bquat
TSP Talk Royalty
- Reaction score
- 815
So stocks tried to go back up but top of long term channel held as resistance and good chance of more weakness. Couple not quite out of being embedded but very close. In bonds long term channel's bottom acted as resistance: Just my two cents and please comment if you want too. Went back to 5 day moving average for RSI. The 8 day didn't work out as well for a heads up:Both stocks and bonds did not like the rate hikes announcement. With follow through tomorrow anything embedded or trying to embed will drop down into an over bought condition. So tomorrow get a pot of coffee on and watch if this was an overreaction or if profit taking takes hold:
Attachments
Bquat
TSP Talk Royalty
- Reaction score
- 815
More weakness:So stocks tried to go back up but top of long term channel held as resistance and good chance of more weakness. Couple not quite out of being embedded but very close. In bonds long term channel's bottom acted as resistance: Just my two cents and please comment if you want too. Went back to 5 day moving average for RSI. The 8 day didn't work out as well for a heads up:
Attachments
Similar threads
- Replies
- 2
- Views
- 697