Bquat's Account Talk

Hey Bquat. I see that you use TradingView charts. Do you use the free version or the paid? I’m looking for a good free version.


Sent from my iPhone using Tapatalk
 
Playing again with chart to see maybe an entry when dust settles. Cleaning things up a little after 100 DMA test::suspicious:
 

Attachments

  • TV DWCPF.jpg
    TV DWCPF.jpg
    72.2 KB · Views: 252
Was this close enough to gap fill the way gaps have been handled in the last year. Look at the top tail today it is longer that the bottom tail.:worried: My temporary Longterm Channel is drawn this way only because of the 100 DMA holding. It just looked to be a good rebound spot. I added the circles for possible Head and Shoulders pattern if we do go up. Spidey is still on the bearish side which is my brain telling me to be more than 50% bearish . Is there a chance for a correction here? He thinks so.:sick: 
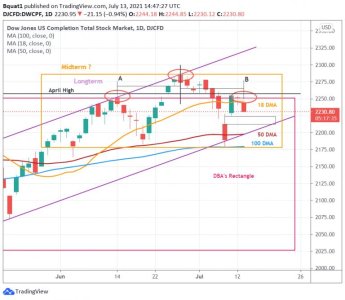
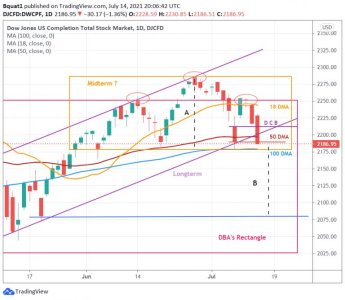
Good chance to embed to the downside tomorrow:
 

Attachments

  • TV DWCPF.jpg
    TV DWCPF.jpg
    66.7 KB · Views: 246
Wow that was fast. I think I will wait and see what happens at the top of the rectangle::suspicious:
 

Attachments

  • TV DWCPF.jpg
    TV DWCPF.jpg
    71.4 KB · Views: 225
Last edited:
So are we there already or is this too fast for a shoulder definition?:nuts: I don't know what to tell you. This was a very quick reversal. I just drew the channel yesterday. Well anyway if I had entered this morning I would still have missed it. There we are testing the April high as resistance and right back at breakout level so we can set back and watch::blink:
 

Attachments

  • TV DWCPF.jpg
    TV DWCPF.jpg
    67.1 KB · Views: 224
Let's go with A=B and just sit back and watch for direction and if this is a shoulder::cool:
 

Attachments

  • TV DWCPF.jpg
    TV DWCPF.jpg
    67.7 KB · Views: 213
Let's go with A=B and just sit back and watch for direction and if this is a shoulder::cool:
Looking more and more like a shoulder. Slowing a bit as we reach the bottom of the last green candle or are the bulls trying to prevent more than a one percent loss to stop the selling today::worried:
 

Attachments

  • TV DWCPF.jpg
    TV DWCPF.jpg
    67.7 KB · Views: 214
I am going to take this as gap fill and H&S confirmation::worried:
 

Attachments

  • TV DWCPF.jpg
    TV DWCPF.jpg
    66.1 KB · Views: 215
Testing bottom of longterm and 50 DMA from below. Spidey is concerned. Quick chart::blink:
 

Attachments

  • TV DWCPF.jpg
    TV DWCPF.jpg
    65.2 KB · Views: 179
Just a worst case chart.:eek: Momentum to the downside increasing. The Head and Shoulder top has the chance of going to the blue line. Spidey is bearish right now. But you know what? I think there's a 60/40 chance of the 100 DMA holding just because it would be a exact double bottom and would be the fifth touch of the Midterm Rectangle but what do I know with this crazy market:suspicious: I am happy that I am in G Fund watching this 100 Day test::cool:
 

Attachments

  • TV DWCPF.jpg
    TV DWCPF.jpg
    70.4 KB · Views: 166
Looks like it hit the lower Bollinger Band. Is that what your seeing also?
I haven't used Bollinger bands. I use RSI on Freestockcharts.com. I can't post the charts but we can embed to the downside if we have another down day tomorrow
 
Just a worst case chart.:eek: Momentum to the downside increasing. The Head and Shoulder top has the chance of going to the blue line. Spidey is bearish right now. But you know what? I think there's a 60/40 chance of the 100 DMA holding just because it would be a exact double bottom and would be the fifth touch of the Midterm Rectangle but what do I know with this crazy market:suspicious: I am happy that I am in G Fund watching this 100 Day test::cool:
Failed test of the 50 DMA from below and four tests of the 100 DMA. The coin is in the air. I am staying 100 G Fund as I am nervous at this current level::worried:
 

Attachments

  • TV DWCPF.jpg
    TV DWCPF.jpg
    68.3 KB · Views: 159
Back
Top