Bquat's Account Talk

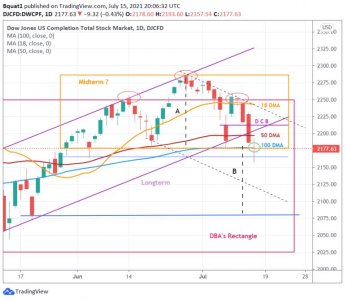
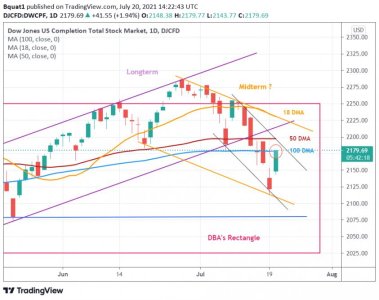
Failed test of the 50 DMA from below and four tests of the 100 DMA. The coin is in the air. I am staying 100 G Fund as I am nervous at this current level::worried:

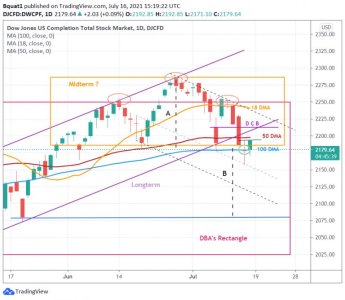
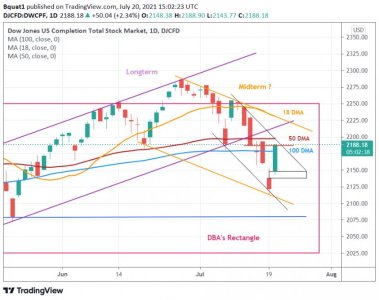
Spidey sense says choppy waters or downright downdraft on S fund. C funds looks a bit stretched. Still in holding pattern and at this point plan on entrance when we get a breakaway off the S fund 100 day moving average. Looks dangerously close to going under though so risk off at the moment. If S fund drops today below 2179…then my entrance on an intraday nearterm dump would be somewhere close to 2155 or close to there. 🤢
 
Just a worst case chart.:eek: 
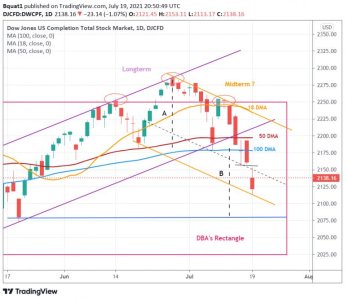
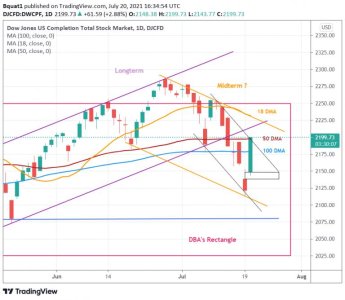
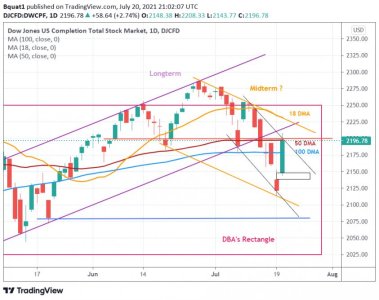
Momentum to the downside increasing. The Head and Shoulder top has the chance of going to the blue line. Spidey is bearish right now. But you know what? I think there's a 60/40 chance of the 100 DMA holding just because it would be a exact double bottom and would be the fifth touch of the Midterm Rectangle but what do I know with this crazy market:suspicious: I am happy that I am in G Fund watching this 100 Day test::cool:
What is this? Coin on it's edge::nuts:
 

Attachments

  • TV DWCPF.jpg
    TV DWCPF.jpg
    69.7 KB · Views: 179
Spidey wants me to draw the bottom of the Midterm Rectangle here. He wants me to realize the market is struggling to get back into the box. He also wants me to be a little more bearish in my guesses to avoid a 60/40 change of a nose bleed::worried:
 

Attachments

  • TV DWCPF.jpg
    TV DWCPF.jpg
    69.9 KB · Views: 155
Let's go with this for now but Spidey is more for the diagonal line near B::worried:
 

Attachments

  • TV DWCPF.jpg
    TV DWCPF.jpg
    74.4 KB · Views: 165
Bquat,

I'm new to all of this so apologies in advance if this has already been looked at, but what do you think abut the 100 ema? That's what the S fund appears to be resting in my chart, and also the area where the S fund falls to when if it dips beneath the 20dma in the last year or so. Or is the 100 dma a more reliable indicator? Just curious.

-Jules
 
Last edited:
The 100 dma is an average of 100 daily points whereas the 100 Ema is weighted more with the more recent points. This may cause it to look like it's downtrending a little bit because the most recent points were down. My 100 dma is flat. I wanted to see the complete 100 daily points average move. I've seen both be used but I use RSI for the market direction changes.
 
Thanks Bquat, I suppose I was wondering if there was a chance this area could serve as support. Just wishful thinking coupled with incomplete knowledge. :smile:
 
Hi fellow retired guy! Who knew retirement could be so damn busy!?!? I don't have a clue how I ever kept the house standing or did stuff with the kids as a Gub'mnt worker!

Just thought I would give a drive by post with a twitter feed I have been on-again/off-again looking at: https://twitter.com/SqueezeMetrics

I find it entertaining with some grains of truth regarding liquidity. I view it as a partial contrarian to my own internal "Spidey". The main reason I am posting about it now is it offered up a linked paper last Friday (the 16th on the Twitter feed) that is a worthwhile read IMO. It took me a couple of readings to digest so give yourself an hour or so.

Good luck all! Happy and safe trading!
 
Cleaned chart up for 100 DMA test from below. Playing with short term::blink:
 

Attachments

  • TV DWCPF.jpg
    TV DWCPF.jpg
    72.7 KB · Views: 148
Cleaned chart up for 100 DMA test from below. Playing with short term::blink:

Feels a little bit like the beginnings of sharp daily swing moves on the way down perhaps. Sure wish I had more in at the moment but feels a bit early to have run up this far. I track an inverse stock market indicator…it is holding on for dear life but has not given much of its gain. Perhaps telling me bad things to come. Decisions…Decisions. 😂🙃
 
Looks like bulls are winning today. Another missed move I couldn't see coming. Staying 100 G Fund::suspicious:
 

Attachments

  • TV DWCPF.jpg
    TV DWCPF.jpg
    72.9 KB · Views: 164
Hi Bquat, I had thought it might rise today, but fear of further movement down kept me from moving in yesterday. Now see Slow Stochastic rising after getting below 20 and wonder will this be a whipsaw that takes us further down or a good entry point. S fund has been weak so thinking C and I funds. Decisions decisions....
 
Wow almost a 3% move up all of a sudden what is up. Definitely unseen coming. Was there a news event that I didn't see? Need some bears to react to make my short term test viable::embarrest:
 

Attachments

  • TV DWCPF.jpg
    TV DWCPF.jpg
    66.4 KB · Views: 200
Wow almost a 3% move up all of a sudden what is up. Definitely unseen coming. Was there a news event that I didn't see? Need some bears to react to make my short term test viable::embarrest:
Ok here it is::cheesy:
 

Attachments

  • TV DWCPF.jpg
    TV DWCPF.jpg
    74.9 KB · Views: 203
Back
Top